How to Setup Amazon Managed Grafana
The Amazon Managed Grafana is a fully managed service for Grafana used to query, visualize, and alert on your metrics, logs, and traces. Grafana provides a centralized dashboard where we can add many data sources.
Deployment
Collecting Metrics
Once Prometheus is fully functional on its own, then we add the HTTP endpoint for Prometheus as a data source for Amazon Managed Grafana, where we can centralize, visualize, query, and alert on those metrics. The Prometheus workspace is fully managed by AWS so therefore is not deployed to an EKS cluster.
Deploy the Amazon Managed Prometheus workspace with the managed-prometheus/workspace component to each platform
account and/or any account where you'd like to collect metrics. Define a stack catalog as follows:
components:
  terraform:
    prometheus:
      metadata:
        component: managed-prometheus/workspace
      vars:
        enabled: true
        name: prometheus
        # Create cross-account role for core-auto to access AMP
        grafana_account_name: core-auto
Then import this stack catalog file anywhere you want to deploy Prometheus. For example, all platform accounts. Then deploy the workspace into each stack:
atmos terraform apply prometheus -s plat-use2-sandbox
atmos terraform apply prometheus -s plat-use2-dev
atmos terraform apply prometheus -s plat-use2-staging
atmos terraform apply prometheus -s plat-use2-prod
Once you have the workspace provisioned, then add a collector. There are a number of collectors that can be set up with Prometheus, but we primarily use the Amazon managed collector for EKS, commonly referred to as a "scraper". The scraper is deployed alongside an EKS cluster and is granted permission to read metrics for that EKS cluster. That scraper then forwards logs to Amazon Managed Prometheus.
Deploy the managed collected with the eks/prometheus-scraper component to any account with Prometheus where you'd like
to collect metrics from EKS. Define a stack catalog as follows:
components:
  terraform:
    eks/prometheus-scraper:
      vars:
        enabled: true
        name: prometheus-scraper
        prometheus_component_name: prometheus
Then import this stack catalog file anywhere you want to deploy Prometheus. For example, all platform accounts. Then deploy the workspace into each stack:
atmos terraform apply eks/prometheus-scraper -s plat-use2-sandbox
atmos terraform apply eks/prometheus-scraper -s plat-use2-dev
atmos terraform apply eks/prometheus-scraper -s plat-use2-staging
atmos terraform apply eks/prometheus-scraper -s plat-use2-prod
Finally after the scraper is deployed, we have to finish the Cluster Role Binding configuration with the EKS cluster's
auth map. Note the scraper_role_arn and clusterrole_username outputs from the eks/prometheus-scraper component and
set them to rolearn and username respectively with the map_additional_iam_roles input for eks/cluster.
components:
  terraform:
    eks/cluster:
      vars:
        map_additional_iam_roles:
          # this role is used to grant the Prometheus scraper access to this cluster. See eks/prometheus-scraper
          - rolearn: "arn:aws:iam::111111111111:role/AWSServiceRoleForAmazonPrometheusScraper_111111111111111"
            username: "acme-plat-ue2-sandbox-prometheus-scraper"
            groups: []
Then reapply each given cluster component.
Scraping Logs
Logs are collected with Loki and Promtail by Grafana.
Grafana Loki is a set of resources that can be combined into a fully featured logging stack. Unlike other logging systems, Loki is built around the idea of only indexing metadata about your logs: labels (just like Prometheus labels). Log data itself is then compressed and stored in chunks in object stores such as S3 or GCS, or even locally on a filesystem.
Whereas Promtail is an agent which ships the contents of local logs to Loki. Promtail scrapers logs from an EKS cluster, and can be enabled to receive logs on its own via an API server.
Both Loki and Promtail are deployed to EKS via Helm charts. Deploy these with the eks/loki and eks/promtail
components respectively.
First deploy eks/loki. Add the eks/loki component and stack catalog as such:
We recommend using an internal ALB for logging services. You must connect to the private network to access the Loki endpoint.
components:
  terraform:
    eks/loki:
      vars:
        enabled: true
        name: loki
        alb_controller_ingress_group_component_name: eks/alb-controller-ingress-group/internal
Then deploy the eks/promtail component with an example stack catalog as follows:
components:
  terraform:
    eks/promtail:
      vars:
        enabled: true
        name: promtail
Import both into any account where you have an EKS cluster, and deploy then in order. For example plat-use2-dev.
atmos terraform apply eks/loki -s plat-use2-dev
atmos terraform apply eks/promtail -s plat-use2-dev
Amazon Managed Grafana Workspace
Now that we have metrics and logs collected in each platform account, we want to create a central "hub" for accessing that data. That hub is Grafana.
The primary component of Amazon Managed Grafana is the workspace. The Amazon Managed Grafana workspace is the logically isolated Grafana server, where we can create Grafana dashboards and visualizations to analyze your metrics, logs, and traces without having to build, package, or deploy any hardware to run your Grafana servers.
Deploy the centralized Amazon Managed Grafana workspace to core-auto with the managed-grafana/workspace component.
For example
components:
  terraform:
    grafana:
      metadata:
        component: managed-grafana/workspace
      vars:
        enabled: true
        name: grafana
        private_network_access_enabled: true
        sso_role_associations:
          - role: "ADMIN"
            group_ids:
              - "xxxxxxxx-xxxx-xxxx-xxxx-xxxxxxxxxxxx"
        # This grafana workspace will be allowed to assume the cross
        # account access role from these prometheus components.
        # Add all plat accounts after deploying prometheus in those accounts
        prometheus_source_accounts:
          - component: prometheus
            tenant: plat
            stage: sandbox
          - component: prometheus
            tenant: plat
            stage: dev
Import this component in core-use2-auto (your primary region), and then deploy this component with the following:
atmos terraform apply grafana -s core-use2-auto
Managing Terraform
We have fully Terraformed this Grafana-based monitoring system using the Grafana Terraform Provider. We deploy an API Key after creating the workspace and then use that API key to create all necessary Grafana sub components, including all data sources and dashboards.
Create that API key with the managed-grafana/api-key component.
components:
  terraform:
    grafana/api-key
      metadata:
        component: managed-grafana/api-key
      vars:
        enabled: true
        grafana_component_name: grafana
Then deploy it in the same account as the Grafana workspace.
atmos terraform apply grafana/api-key -s core-use2-auto
By default, this Grafana API key will expire after 30 days (max). The component is configured to automatically suggest replacing API key after that expiration date, but Terraform will need to be reapplied to refresh that key.
Now other Grafana sub components will be able to pull that API key from AWS SSM and use it to access the Grafana workspace.
Adding Data Sources
In order to visualize and query metrics and logs, we need to add each as a data source for the centralized Amazon Managed Grafana workspace. We have created a data source component for each type.
Use the managed-grafana/data-source/managed-prometheus component to add the Managed Prometheus workspace as a data
source for Grafana. Add the following stack catalog:
components:
  terraform:
    grafana/datasource/defaults:
      metadata:
        component: managed-grafana/data-source/managed-prometheus
        type: abstract
      vars:
        enabled: true
        grafana_component_name: grafana
        grafana_api_key_component_name: grafana/api-key
        prometheus_component_name: prometheus

    grafana/datasource/plat-sandbox-prometheus:
      metadata:
        component: managed-grafana/data-source/managed-prometheus
        inherits:
          - grafana/datasource/defaults
      vars:
        name: plat-sandbox-prometheus
        prometheus_tenant_name: plat
        prometheus_stage_name: sandbox

    grafana/datasource/plat-dev-prometheus:
      metadata:
        component: managed-grafana/data-source/managed-prometheus
        inherits:
          - grafana/datasource/defaults
      vars:
        name: plat-dev-prometheus
        prometheus_tenant_name: plat
        prometheus_stage_name: dev

    # Plus all other Prometheus deployments ...
Then deploy the components into the same stack as Grafana. For example core-use2-auto:
atmos terraform apply grafana/datasource/plat-sandbox-prometheus -s core-use2-auto
atmos terraform apply grafana/datasource/plat-dev-prometheus -s core-use2-auto
atmos terraform apply grafana/datasource/plat-staging-prometheus -s core-use2-auto
atmos terraform apply grafana/datasource/plat-prod-prometheus -s core-use2-auto
Use the managed-grafana/data-source/loki component to add Grafana Loki as a data source for Grafana. Add the following
stack catalog to the same catalog you used for the Prometheus data sources.
components:
  terraform: ...

  # These use the same default data source component defined for the prometheus
  # data source components, since the inputs and structure are the mostly the same
  grafana/datasource/plat-sandbox-loki:
    metadata:
      component: managed-grafana/data-source/loki
      inherits:
        - grafana/datasource/defaults
    vars:
      name: plat-sandbox-loki
      loki_tenant_name: plat
      loki_stage_name: sandbox

  grafana/datasource/plat-dev-loki:
    metadata:
      component: managed-grafana/data-source/loki
      inherits:
        - grafana/datasource/defaults
    vars:
      name: plat-dev-loki
      loki_tenant_name: plat
      loki_stage_name: dev

  # Plus all other Loki deployments ...
Then deploy the components into the same stack as Grafana. For example core-use2-auto:
atmos terraform apply grafana/datasource/plat-sandbox-loki -s core-use2-auto
atmos terraform apply grafana/datasource/plat-dev-loki -s core-use2-auto
atmos terraform apply grafana/datasource/plat-staging-loki -s core-use2-auto
atmos terraform apply grafana/datasource/plat-prod-loki -s core-use2-auto
Creating Dashboards
We fully support Terraformed Grafana dashboards with the managed-grafana/dashboard component. Search the
Grafana Dashboard Library to find the dashboards that best suite your
requirements. Once you've found a dashboard, copy the dashboard URL from "Download JSON". Right click "Download JSON"
and select "Copy Link Address". This is the dashboard URL we need.
Now create a catalog entry. For example, see the stack catalog below where we create a dashboard for each of our data sources defined earlier.
When you import a dashboard in the Grafana UI, you can specify the dashboard inputs after importing. For these
components, we instead specify the inputs that we want to replace before creating the dashboard. We do that with
var.config_input. This map variable will take a specific string as the map key and replace all occurrences of that
string with the given value. However to know what that input value is, you will need to open the dashboard JSON and find
any value in ${ } format; although these can usually be logically determined by the type of the data source prefixed
with DS_. For example a Prometheus data source would likely be ${DS_PROMETHEUS} and a Loki data source would likely
be ${DS_LOKI}. Be sure to include ${ } in the map key; we want to replace it entirely in the rendered JSON.
components:
terraform:
grafana/dashboard/defaults:
metadata:
component: managed-grafana/dashboard
type: abstract
vars:
enabled: true
grafana_component_name: grafana
grafana_api_key_component_name: grafana/api-key
grafana/dashboard/plat-sandbox-prometheus:
metadata:
component: managed-grafana/dashboard
inherits:
- grafana/dashboard/defaults
vars:
dashboard_name: acme-plat-ue2-sandbox-prometheus
dashboard_url: "https://grafana.com/api/dashboards/315/revisions/3/download"
config_input:
"${DS_PROMETHEUS}": "acme-plat-ue2-sandbox-prometheus"
grafana/dashboard/plat-sandbox-loki:
metadata:
component: managed-grafana/dashboard
inherits:
- grafana/dashboard/defaults
vars:
dashboard_name: acme-plat-ue2-sandbox-loki
dashboard_url: "https://grafana.com/api/dashboards/13639/revisions/2/download"
config_input:
"${DS_LOKI}": "acme-plat-ue2-sandbox-loki"
grafana/dashboard/plat-dev-prometheus:
metadata:
component: managed-grafana/dashboard
inherits:
- grafana/dashboard/defaults
vars:
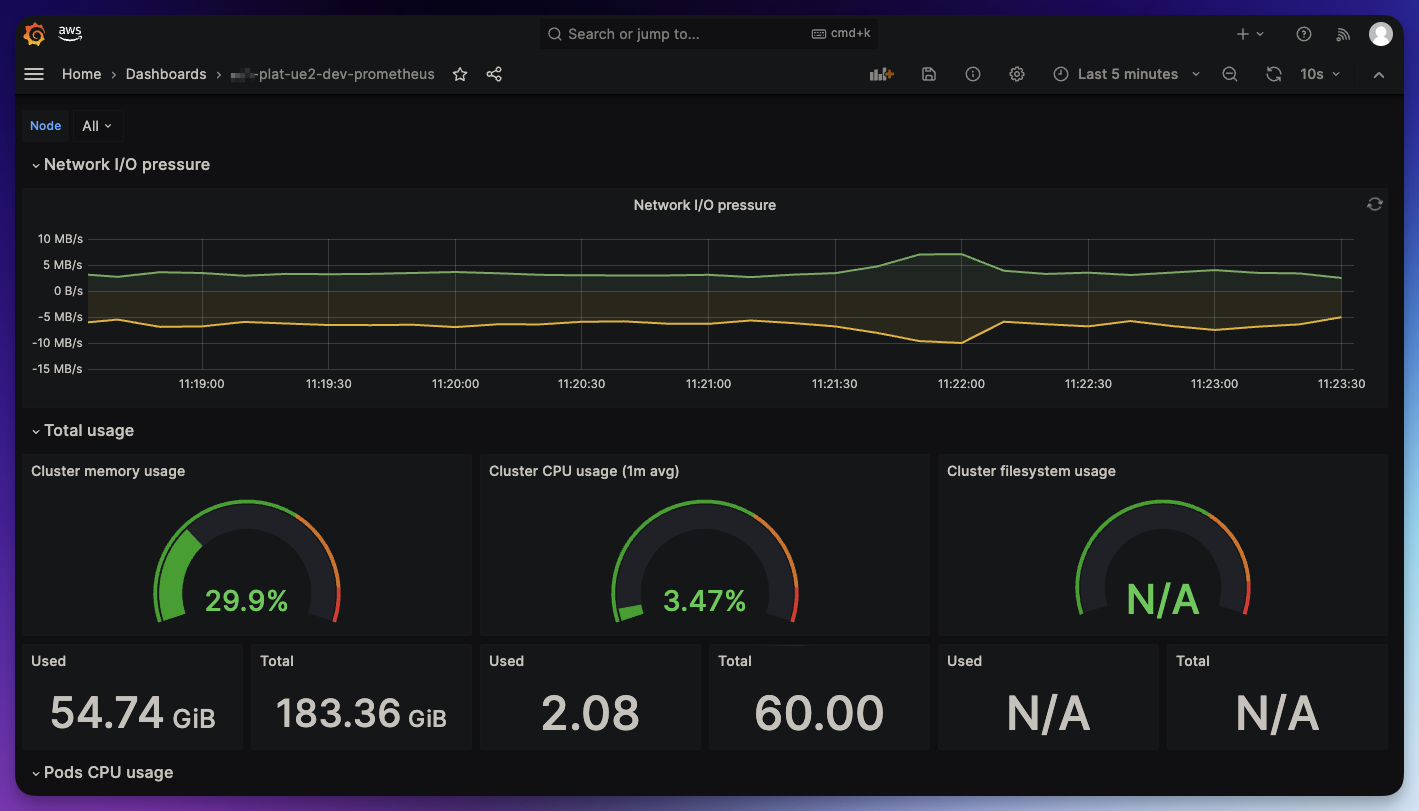
dashboard_name: acme-plat-ue2-dev-prometheus
dashboard_url: "https://grafana.com/api/dashboards/315/revisions/3/download"
config_input:
"${DS_PROMETHEUS}": "acme-plat-ue2-dev-prometheus"
grafana/dashboard/plat-dev-loki:
metadata:
component: managed-grafana/dashboard
inherits:
- grafana/dashboard/defaults
vars:
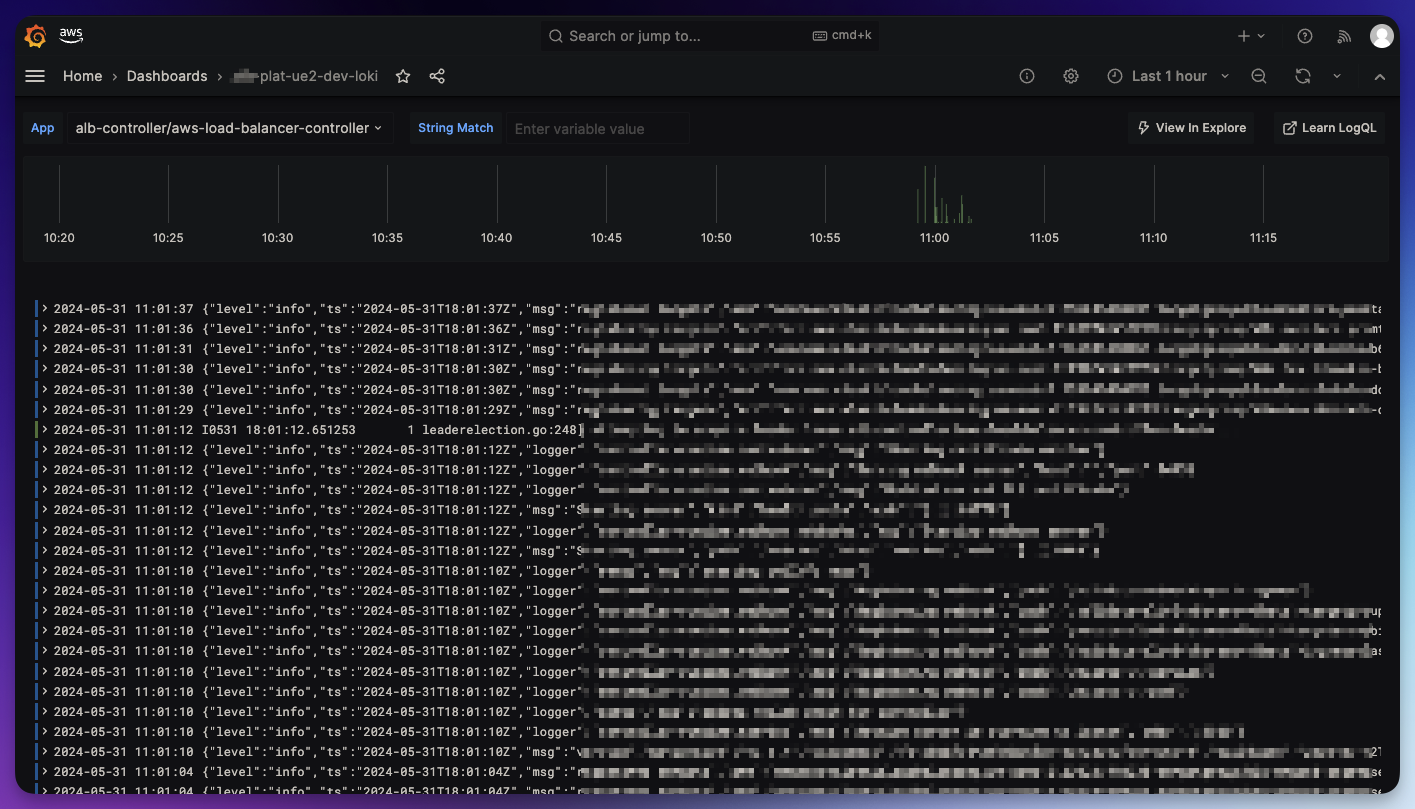
dashboard_name: acme-plat-ue2-dev-loki
dashboard_url: "https://grafana.com/api/dashboards/13639/revisions/2/download"
config_input:
"${DS_LOKI}": "acme-plat-ue2-dev-loki"
# Plus all other data sources in staging, prod, etc ...
Now import this stack file into the same stack as Grafana, for example core-use2-auto, and deploy those components:
atmos terraform apply grafana/dashboard/plat-sandbox-prometheus -s core-use2-auto
atmos terraform apply grafana/dashboard/plat-sandbox-loki -s core-use2-auto
atmos terraform apply grafana/dashboard/plat-dev-prometheus -s core-use2-auto
atmos terraform apply grafana/dashboard/plat-dev-loki -s core-use2-auto
And that's it! Validate the set up in Grafana. Open the Grafana workspace, select the menu in the top left, click "Dashboards". Choose any of your newly deployed dashboards.