How to Monitor Everything with Datadog
This outlines Cloud Posse's practical approach to monitoring with Datadog, focusing on defining reusable Service Level Indicators (SLIs) and Service Level Objectives (SLOs) for consistent implementation across customer environments. It aims to help businesses streamline monitoring and incident management by aligning technical performance with business goals.
Our goal with this document is to identify the reusable, standard SLI/SLO for our customers that we can readily implement time and time again.
This document goes very deep into the theory and practice of monitoring with Datadog. If you are looking for a quick start guide, see our Setup Guide for DataDog. If you are trying to solve a specific problem, checkout our tutorials for DataDog.
Problem
A typical business operating in AWS has literally tens of thousands of data points that leads to analysis paralysis. If we sit down and try to make sense of it all, we realize knowing what is critical and when is non-trivial. Modern advances in monitoring platforms have brought Artificial Intelligence and Anomaly Detection, but those are not foolproof. There is no silver bullet. AI can not tell us what is mission-critical for our business to succeed. That’s because they only see part of the story. They have no visibility into our finances or business objectives. Defining Service Level Objectives, therefore, becomes paramount and while mathematically trivial to compute, but defining what are services in the context of your organization and what your objectives are, is still very subjective. There’s an overwhelming amount of theory on what we should do, but not that much prescriptive step-by-step advice on how to actually implement it using IaC resulting in a fully functioning system.
Solution
-
Define a process for us to help our customers easily define SLOs that are special to their business
-
Define a process for us to identify generalized SLOs for every one of our customers that have a very common stack
-
Use SLOs to determine the health of a service, where a service is not always what end-users of the business, but might be internal customers
-
Use SLOs to reduce the number of alerts and concentrate them on when specifically the objectives have been violated
Definitions
- Service
- Any group of one or more applications (or "components") with a shared purpose for some customer (either internal to some team or other service or external with end-users).
- Service Level Indicator (SLI)
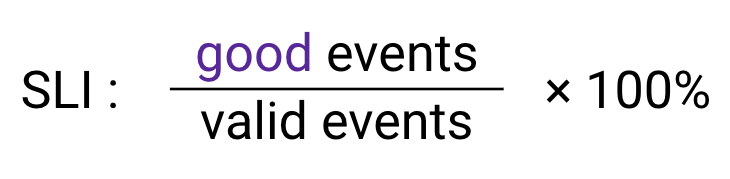
- A quantitative measurement of a service's performance or reliability (e.g. the amount of time a transaction took). SLIs may or may not be expressed as percentages. In Datadog, the SLI is implemented as a metric, synthetic or aggregation of one or more monitors. There's nothing called an SLI in Datadog.
- Service Level Objective (SLO)
- A target percentage for an SLI over a specific period of time. It's always expressed as a percentage. In Datadog it's a specific resource type defined with a numerator and denominator. A score of 100% is excellent; 0% is dead. Datadog has native support for SLOs as a resource.
- Service Level Agreement (SLA)
- An explicit (e.g. contractual agreement) or implicit agreement between a client and service provider stipulating the client's reliability expectations and service provider's consequences for not meeting them.
- Error Budget
- The allowed amount of unreliability derived from an SLO's target percentage (100% - target percentage) that is meant to be invested into product development. There's a corresponding Burn Rate associated with an Error Budget that is equally important to understand because it's the rate of change. Datadog automates burnrate as part of the widget.
- MTTF (mean time to failure)
- The outage frequency.
- MTTR (mean time to restore)
- The outage duration and is defined as it is experienced by users: lasting from the start of a malfunction until normal behavior resumes.
- Availability
- A percentage defined as (uptime)/(total length of time), using appropriate units (e.g. seconds), or (1 - (MTTR/MTTF)) x 100%.
- RED method
- (Rate, Errors, and Duration) focuses on monitoring your services, leaving their infrastructure aside and giving you an external view of the services themselves—in other words, from the client's point of view.
- USE method
- (Utilization, Saturation, and Errors) focuses on the utilization of resources to quickly identify common bottlenecks; however, this method only uses request errors as an external indicator of problems and is thus unable to identify latency-based issues that can affect your systems as well.
Some definitions borrowed from Datadog's Key Terminology.
Theory
Golden Signals (SLIs)
Golden Signals are a form of telemetry that applies to anything with throughput. Anything that’s not a golden signal is considered general telemetry.
- Latency
- The time it takes to service a request. It’s important to distinguish between the latency of successful requests and the latency of failed requests.
- Traffic
- A measure of how much demand is being placed on your system, measured in a high-level system-specific metric. For a web service, this measurement is usually HTTP requests per second.
- Errors
- The rate of requests that fail, either explicitly (e.g., HTTP 500s), implicitly (for example, an HTTP 200 success response, but coupled with the wrong content), or by policy (for example, "If you committed to one-second response times, any request over one second is an error").
- Saturation
- How "full" your service is. A measure of your system fraction, emphasizing the resources that are most constrained (e.g., in a memory-constrained system, show memory; in an I/O-constrained system, show I/O).
These golden signals are closely related to the RED metrics for microservices: rate, errors, and duration, and the older USE method focusing on utilization, saturation, and errors. These signals are used to calculate the service level objectives (SLOs).
Other Signals
Here are other useful metrics that are examples that don’t necessarily fit into the Golden Signals.
Pull Requests
- Time to Merge
- The duration between the creation of a pull request and when it's merged. This metric reflects the efficiency of the review and merging process.
- Lead Time
- The total time from when work on a pull request starts until it's merged. It measures the overall speed of the development process.
- Size (LOC)
- The number of lines of code (LOC) changed in a pull request. This metric helps gauge the complexity and potential impact of the changes.
- Flow Ratio
- The ratio of the total number of pull requests opened to those closed in a day. It indicates whether the team's workflow is balanced and sustainable.
- Discussions & Comments
- The number of comments and discussions on a pull request. This metric shows the level of collaboration and code review quality.
- Force Merged by Admins (bypassing approvals)
- The number of pull requests merged by admins without the usual approval process. This metric highlights instances where standard review procedures were skipped.
Code Quality
- Code Coverage
- The percentage of your codebase covered by automated tests. This metric helps ensure that your code is thoroughly tested.
- Static Code Analysis
- The number of issues found by static code analysis tools. This metric helps identify potential bugs and security vulnerabilities.
- Defect Escape Rate
- The percentage of defects found in production that weren't caught by automated tests. This metric indicates the effectiveness of your testing strategy.
Customer Experience
- Page Load Time
- The time it takes for a web page to load. This metric is crucial for ensuring a positive user experience.
- Browser Interaction Time
- The time it takes for a user to interact with a web page. This metric helps gauge the responsiveness of your application.
- Server Error Rate
- The percentage of server errors returned to users. This metric indicates the reliability of your backend infrastructure.
- JS Errors
- The number of JavaScript errors encountered by users. This metric helps identify issues that impact the user experience.
Service-Oriented View
What is a Service?
-
A service is anything that warrants having an SLO
-
A service has a contract with internal parties or external parties to provide a “service” with certain guarantees. Guarantees with a contractual commitment are SLAs.
-
We Should be able to look at a business service and drill down to the alerts affecting that service
Questions to ask:
-
What are the services we provide? e.g. API
-
Who are the consumers of those services? e.g. internal users or customers
-
Who is the support team of those services?
Error Budget
The Error Budget determines risk tolerance. It is usually a calculation of the remaining time in a given period that the SLO can be violated before the SLA is violated.

When the budget is depleted (nearing 0%), reliability should be prioritized, which often results in:
- freeze feature releases
- prioritize postmortem items
- improve automation over human toil
- improve monitoring and observability
- consult/collaborate with SRE
When an Error Budget is abundant (remaining error budget > 0%), velocity should be prioritized, which results in:
- release new features
- expected system changes
- try risky (but valuable) experiments
Our Strategy
-
Decide on what qualifies as a “service” for the business
-
For every service, decide on how to quantify the 4 golden signals, these are your SLIs
-
Determine how to create SLO’s from these SLIs over time. This should be a simple math formula over time.
-
Incidents are created ONLY in response to violations of the SLO for some period of time t.
-
There should be a 24 hour, 7 day, 30 day and 1 year SLO (for customers).
-
All alerts that relate to some SLO and Incident share same common tag convention.
-
Our SLO Dashboards should be by Service, coalescing into Team Dashboards, which further group into Organization Dashboards.
-
Organization/Team Dashboards should include a list of services (as we can only use DD’s APM Service for things that execute - such as containers, lambdas, and hosts)
-
Each service should have enough monitors to accurately describe when it is operating correctly and when it is not, no more. Ideally 1-3 SLIs per user journey [source].
As Simple as Possible, No Simpler
To avoid an overly complex, and eventually unmaintainable monitoring system we propose avoiding unnecessary complexity, such as:
- Alerts on different latency thresholds, at different percentiles, on all kinds of different metrics
- Extra code to detect and expose possible causes
- Associated dashboards for each of these possible causes
The sources of potential complexity are never-ending. Like all software systems, monitoring can become so complex that it’s fragile, complicated to change, and a maintenance burden. Therefore, design your monitoring system with an eye toward simplicity. In choosing what to monitor, keep the following guidelines in mind:
- The rules that catch real incidents most often should be as simple, predictable, and reliable as possible.
- Data collection, aggregation, and alerting configuration that is rarely exercised (e.g., less than once a quarter for some SRE teams) should be up for removal.
- Signals that are collected, but not exposed in any prebaked dashboard nor used by any alert, are candidates for removal.
Theory into Practice
SLIs
We should create monitors for the Golden Signals for a given service. These are the SLIs.
We can make SLIs a percentage out of 100%.
Percentages are easy to understand by the widest audience, for example, 0% is bad, 100% is good.
In Datadog, we can create a monitor for each SLI.
We can also create a Datadog SLO for each SLI. Every SLI may or may not be a Datadog SLO. An SLI may be part of one or more SLOs (e.g. By Monitor Uptime). See Datadog Docs for details.

SLAs
SLAs should be thought of like SLOs but on an annual basis and tied to a contractual commitment (expectations, impacts, and consequences) with customers. These usually have penalties associated with them.
Additionally, SLAs are typically on a calendar year, and not a rolling window of 365 days.
SLOs
With well-defined SLOs we can ensure that everyone from the business side to engineering is aligned on what’s important and what the goals are for the business at large.
- There is no one SLO. Each service gets its own SLO.
- Combine significant SLIs for a given capability into a single SLO for that capability
- A dashboard must exist that aggregates all SLOs in one place.
- Technically, SLOs are not restricted to just what’s in Datadog, however, that’s just what we’re able to monitor.
- Not every SLO is associated with an SLA
SLOs will not necessarily be the same per business.
Goals
- As few SLOs as possible, but no fewer
- Aggregate as much as possible into an SLO, but for the right audience
Examples
| Business Impact | Good examples of SLOs | Bad Examples of SLOs |
|---|---|---|
| Our SEO experts require that pages respond within 300ms or we will drop in rankings. The website receives most of it’s traffic from natural search. | 99.95% of pages respond with a 200 response code in less than 300ms | CPU utilization is less than 95% SQL Database Read I/O is at 90% utilization |
| As an e-commerce business, users must be able to add products to their cart and checkout or have no revenue. | 99.99% of cart transactions succeed without error. 99.99% of checkout transactions succeed without error. | |
| As a online store, customers are much more likely to purchase products with images than with placeholder images. | 99.99% of images served are actual product images (e.g. 99.99% of images are served within a latency of 100ms 99.99% of images are served with a status code of 2XX |
Implementation
Datadog's SLO Page and Terraform resource
We should have multiple early indicators (aka thresholds) for when the SLO is in jeopardy: e.g. when 10%, 25%, 50%, 75% of the error budget is exhausted.
Target: 99.9% Uptime
Error Budget: 0.10
“...at this rate, you’ll exhaust the error budget (violate the SLO) in X time.”
Every monitor (SLI) that influences a given SLO should share a common tag value (E.g. slo:myapp) with the SLO. In other words, the SLO should be tagged slo:myapp and the monitors (SLI) corresponding to that (the golden signals) should also then be tagged slo:myapp.
Datadog SLOs are implemented on a rolling window, while SLAs are may be tied to a calendar period (e.g. the calendar year).
# Create a new Datadog service level objective
resource "datadog_service_level_objective" "foo" {
  name        = "Example Metric SLO"
  type        = "metric"
  description = "My custom metric SLO"
  query {
    numerator   = "sum:my.custom.count.metric{type:good_events}.as_count()"
    denominator = "sum:my.custom.count.metric{*}.as_count()"
  }

  # 7 day rolling window
  thresholds {
    timeframe       = "7d"
    target          = 99.9
    warning         = 99.99
    target_display  = "99.900"
    warning_display = "99.990"
  }

  # 1 month rolling window
  thresholds {
    timeframe       = "30d"
    target          = 99.9
    warning         = 99.99
    target_display  = "99.900"
    warning_display = "99.990"
  }

  # 1 year rolling window (SLA)
  thresholds {
    timeframe       = "365d"
    target          = 99.9
    warning         = 99.99
    target_display  = "99.900"
    warning_display = "99.990"
  }

  tags = ["foo:bar", "baz"]
}
Questions:
Dashboards
- Only SLOs are on the SLO dashboard
- A dashboard must exist that aggregates all SLOs in one place, group logically by some service
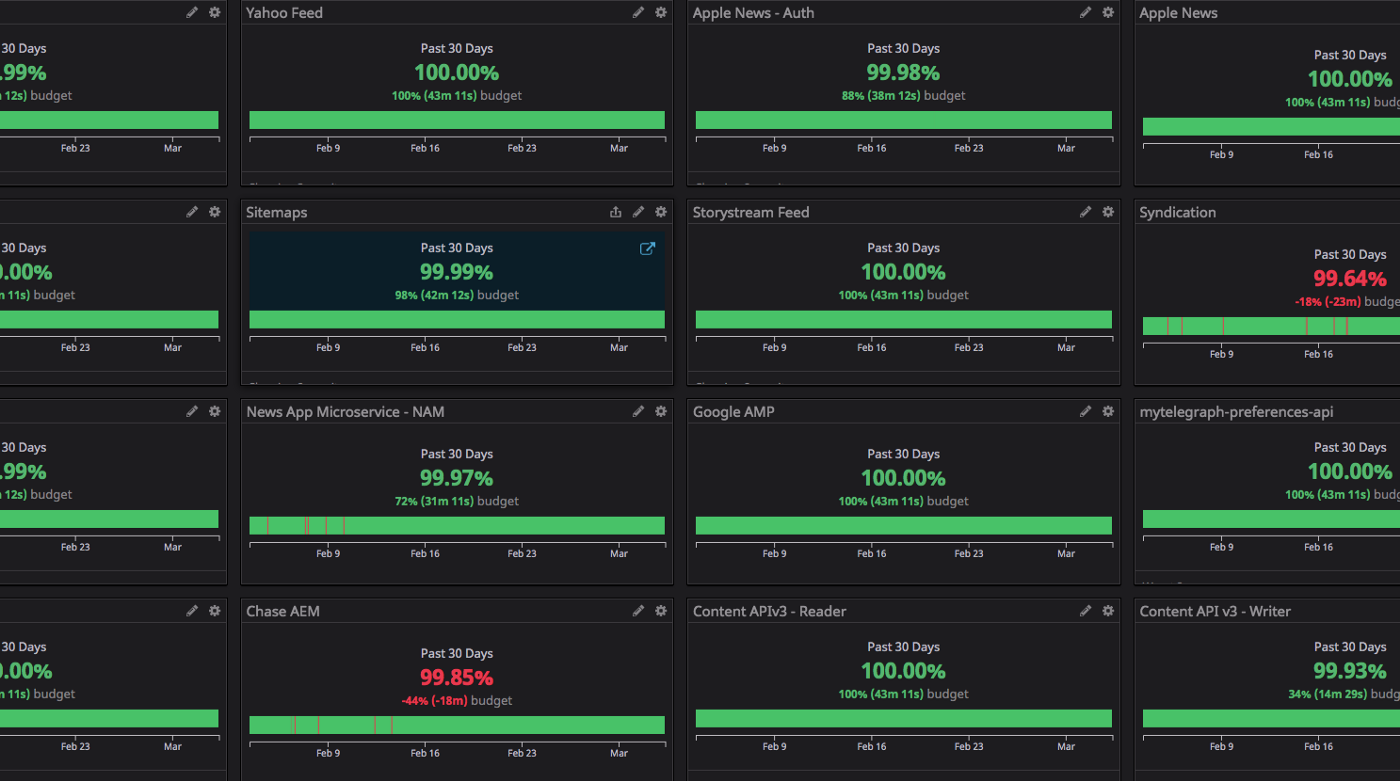
- Each widget displays an SLO with the remaining error budget.
FAQ
- How to visualize error budgets and burn rate?
References
Datadog:
- Track the status of all your SLOs in Datadog
- Best practices for managing your SLOs with Datadog
- Datadog Picking good SLIs
- DataDog Learning Center
- Video: Error budgets for SLOs
Google SRE:
- Monitoring Distributed Systems
- Setting SLOs: a step-by-step guide
- SRE at Google: Our complete list of CRE life lessons
Blogs:
- SREs: Stop Asking Your Product Managers for SLOs
- SRE fundamentals: SLIs, SLAs and SLOs
- Microservice Observability, Part 1: Disambiguating Observability and Monitoring
- 5 metrics Engineering Managers can extract from Pull Requests
- Metrics to Improve Continuous Integration Performance
- SLIs and Error Budgets: What These Terms Mean and How They Apply to Your Platform Monitoring Strategy
- SLOs and SLIs best practices for systems
Appendix
Golden Signals Workbook
| Golden Signals | ||||
|---|---|---|---|---|
| Services | Latency | Traffic | Errors | Saturation |
| Platform Owners | ||||
| Kubernetes Cluster: Pod Scheduling | ||||
| Kubernetes Cluster: Capacity | Healthy Nodes / Total Nodes online | |||
| Application Deployments | Time to Deploy / Total time of | Number of Successful Deployments / Total number of Deployments | 1 - (Unsuccessful Deployments / Total Deployments) | Total Time to Deploy in Seconds per Duration / Seconds in Duration (e.g. 86400 = 1 day) |
| AWS Spend | ||||
| Security & Compliance | ||||
| Time to Acknowledge Time to fix | False Positives Number of Security Vulnerabilities | |||
| Development & PM | ||||
| Pull Request Throughput | 1 - (Time to Close or Merge PR / 1 Sprint) | 1 - (Number of Open PRs / Total Number of PRs) | PRs Open with Tests Passing / Total PRs Open | 1 - (PRs Open / Max Number of PRs Acceptable) |
| Sprint Throughput | Total Number of Sprints to Complete Issues / Total Number of Issues | Issues Transitioned to Done / Total Issues in Sprint | Bugs Added to Active Sprint / Total Issues in Sprint | Total Issues Not Completed / Total Issues in Sprint |
| Microservice / Web Application | ||||
| HTTP Requests | Notes: INFO, DEBUG log level alerts relative to all alerts. | |||
| Transactions | ||||
| Synthetic Requests | ||||
| Customer Experience | ||||
| CI/CD and Release Management | ||||
| Lead Time To Deploy | ||||
| Code Coverage | ||||
| Test Coverage | ||||
| GitHub Action Runs | Time to start build |