Setup Datadog
You need to set up monitoring for all of your newly deployed accounts.
Datadog setup can get started after the accounts have been provisioned, though it won't be incredibly useful until your plat is in place, usually EKS or ECS.
1 Prepare Datadog
You'll need a datadog account and to generate an app key and api key for that datadog account and place them in SSM of
your auto account. These should be placed under datadog/default/datadog_app_key and
datadog/default/datadog_api_key respectively.
To generate these keys we recommend using a Datadog Service Account. This allows you to create a service account with limited permissions to your Datadog account. This is useful for security and auditing purposes. This also allows any admins to rotate the keys without having to go through the account owner.
2 Creating a Datadog Service Account
- Go to your Organizations settings page
- Click on the
Service Accountstab - Click on
New Service Account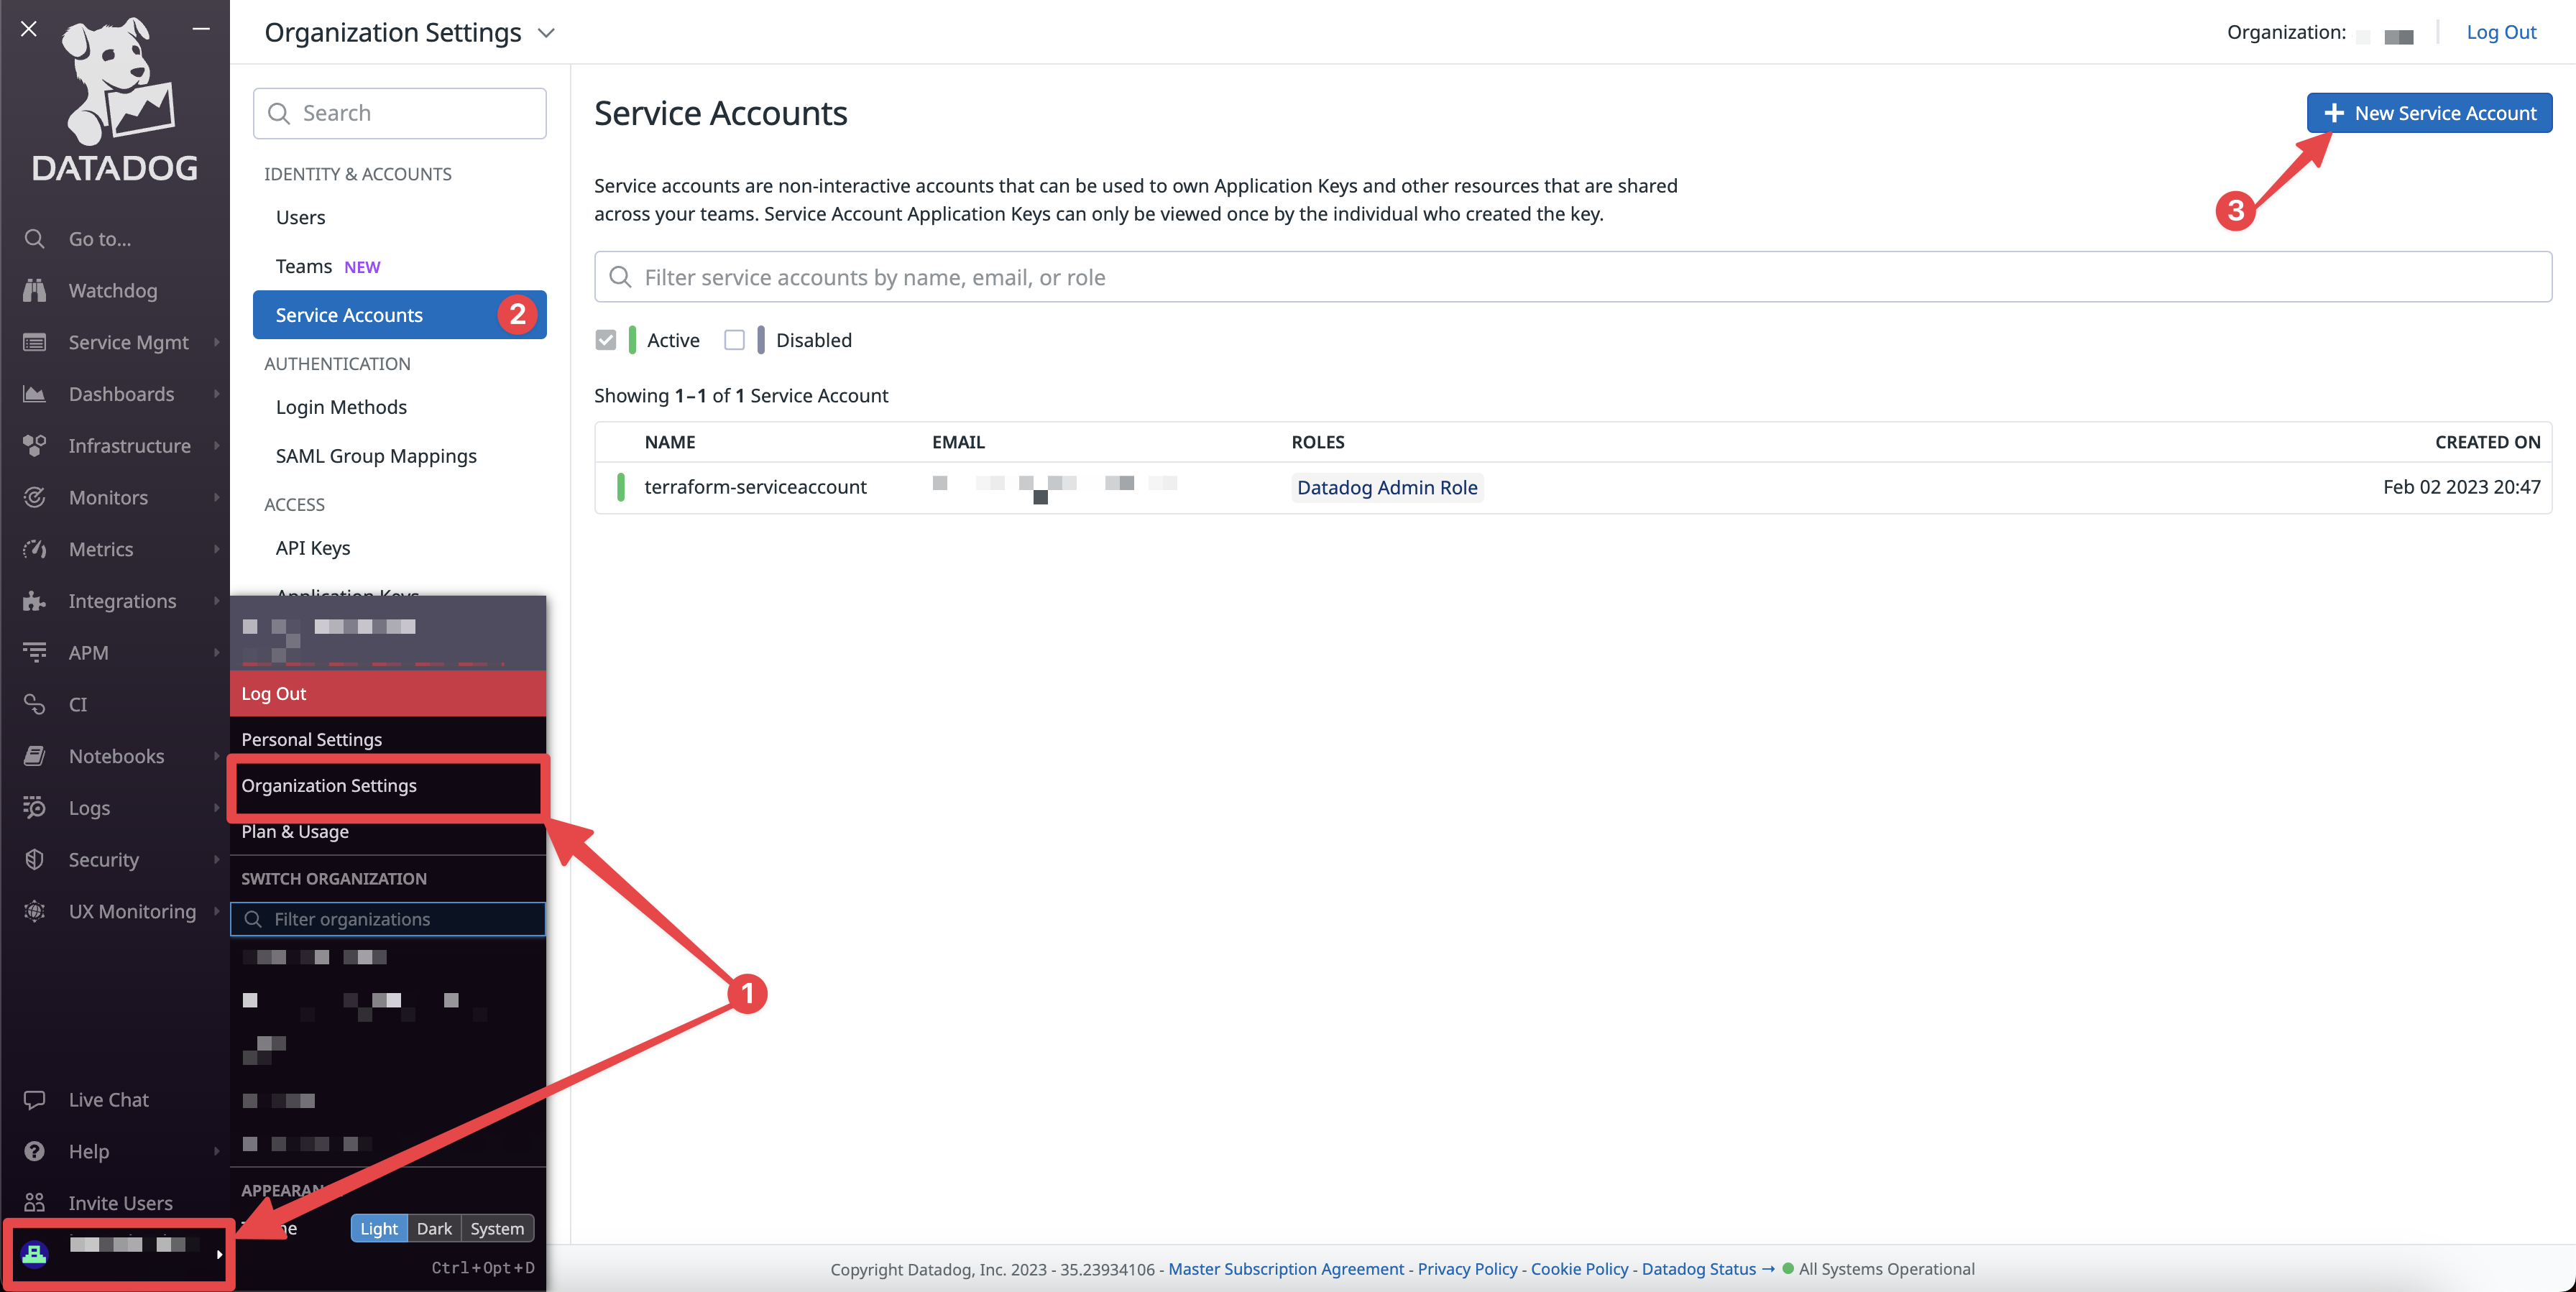
- Give the service account a name and an email address
- Give the service account the
Datadog Admin Role(can be refined later) - Click
Create Service Account - Click the created service account
- Under Application Keys, click
New Key - Give the Application Key a name (we recommend something like
terraform) and clickCreate Key - Copy the
Application Keyfor later. This is yourdatadog_app_key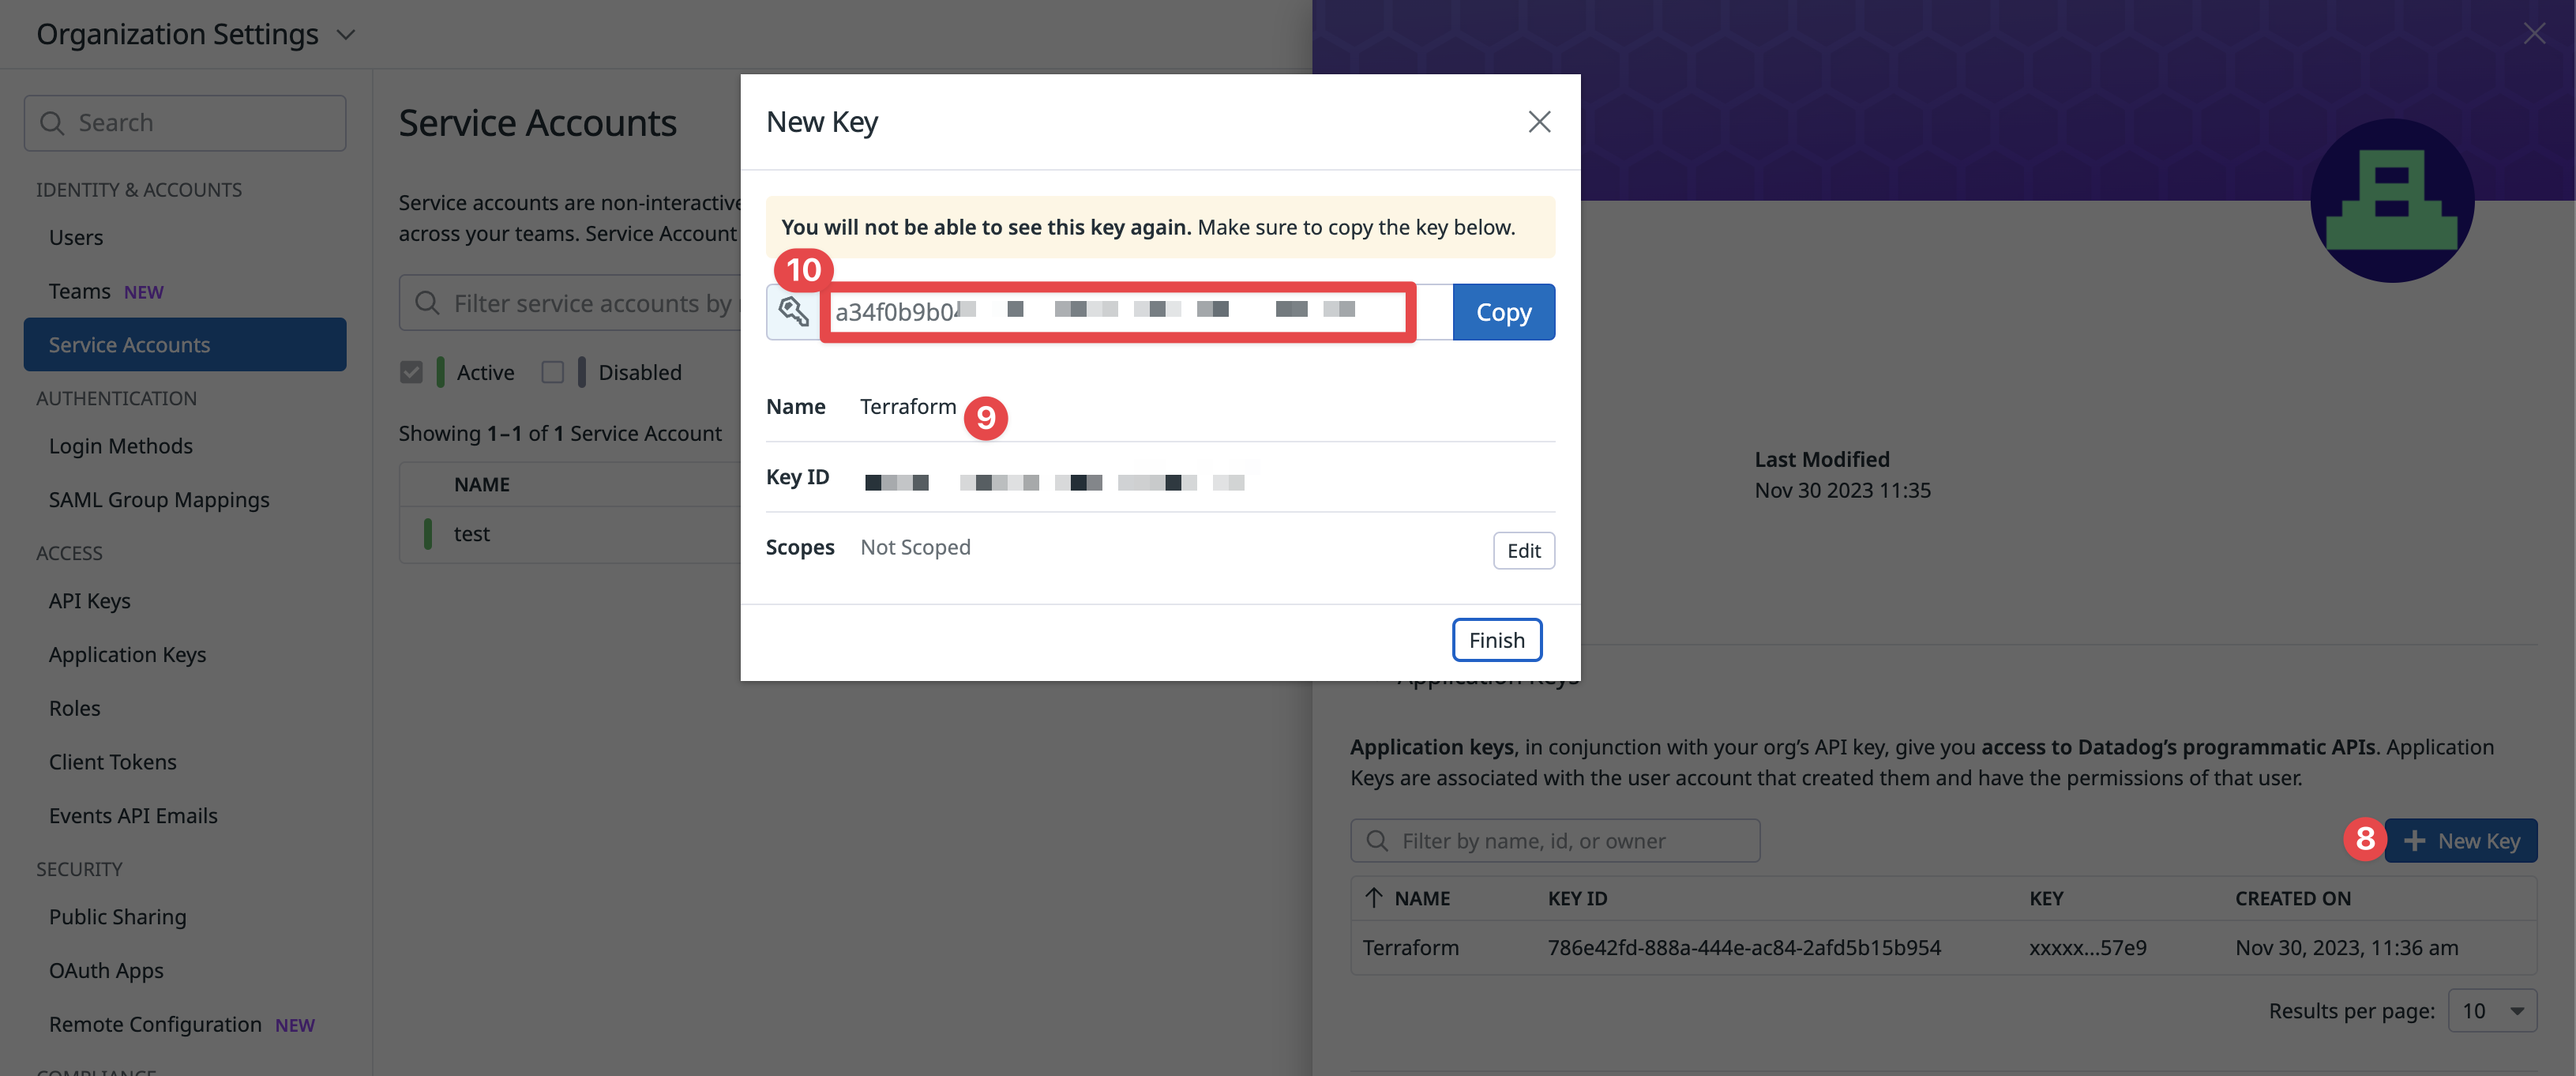
- Under Organization Settings, click
API Keys - Click
New Key - Give the API Key a name (we recommend something like
terraform)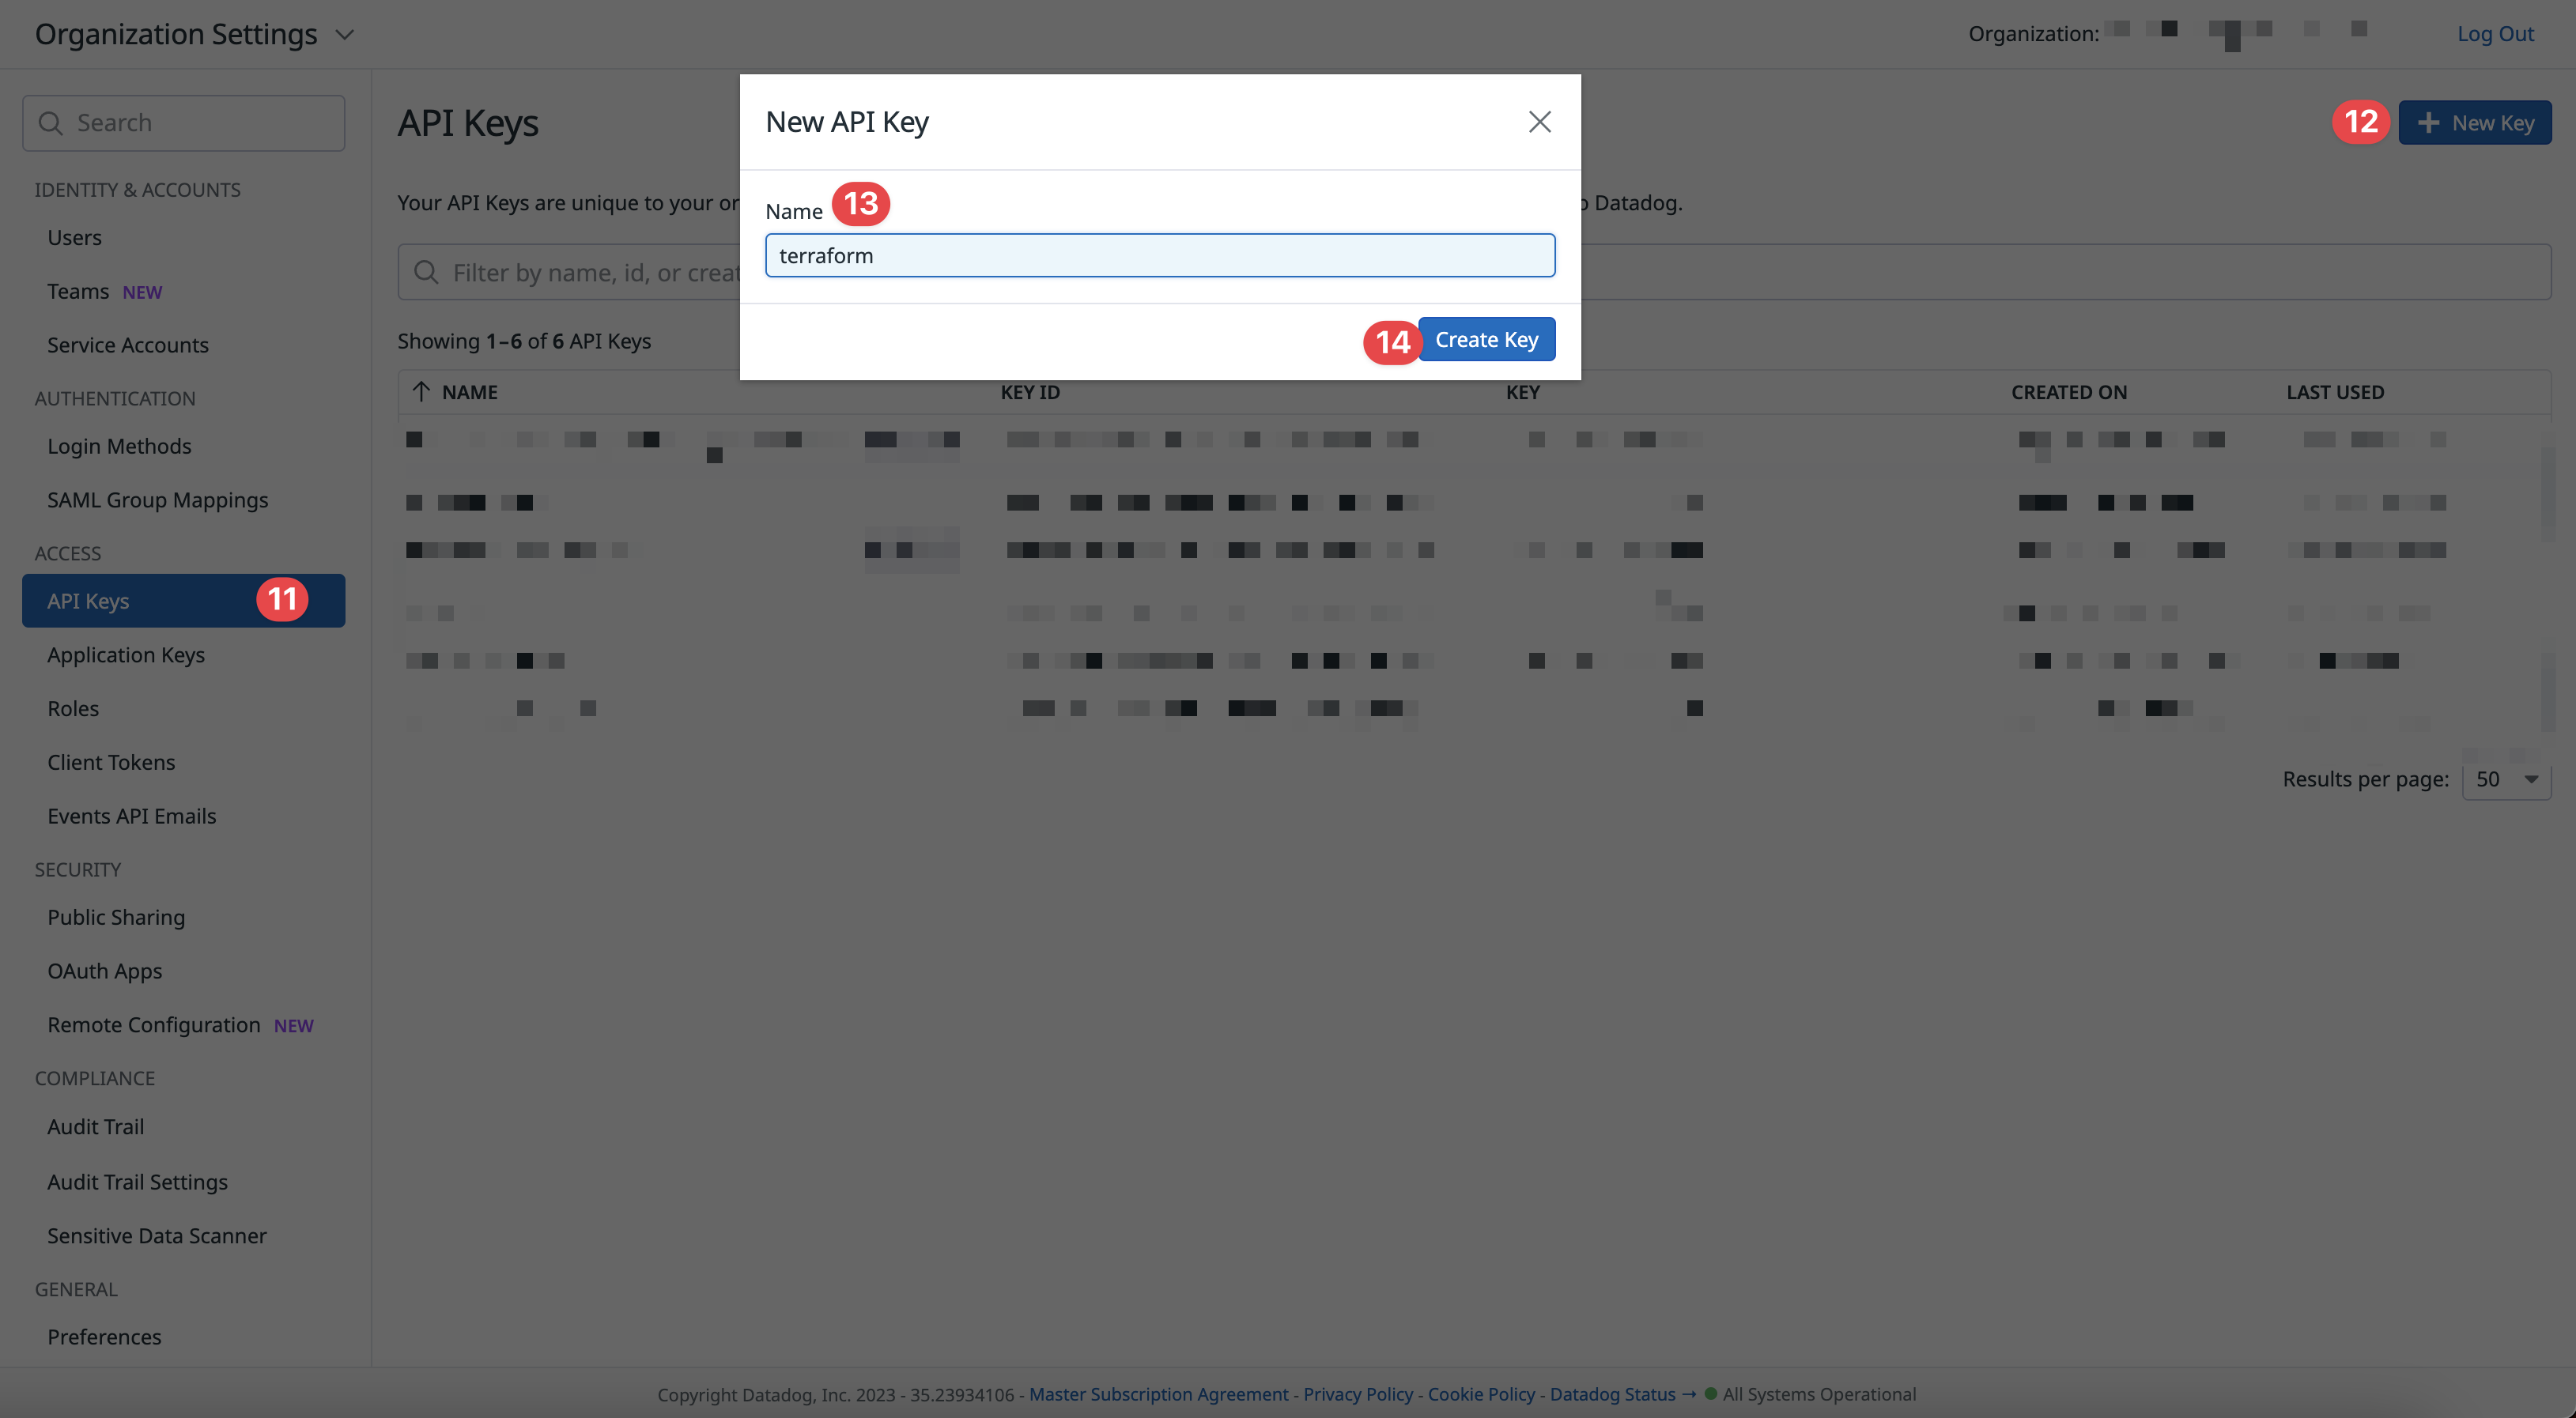
- Click
Create Key - Copy the API Key for later. This is your
datadog_api_key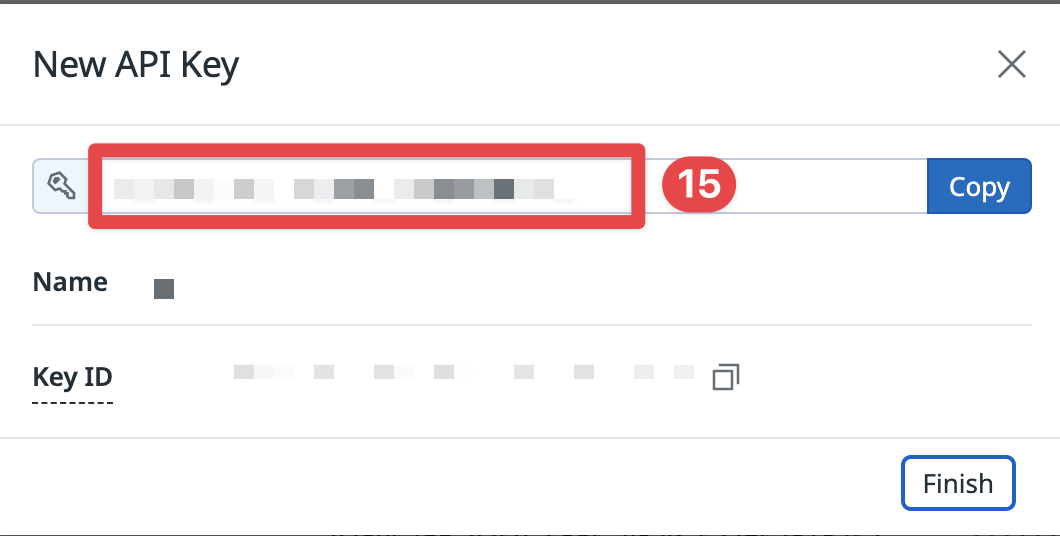
Short Version
There are two core components to the Datadog implementation
Both are deployed to every account except identity and root. They are deployed to the global stack as they are done
once per account.
Once those are setup, we can begin deploying other components, such as
We then deploy a setup for monitoring applications based on whether you use EKS or ECS.
For EKS
For ECS
- ECS-Service has a datadog file that manages all of datadog agent configuration for a service (Datadog as a sidecar)
- ECS Private Locations
Step by Step
You should have a workflow to vendor in your components. This workflow can be run with the following command. Otherwise vendor in each component individually.
Datadog Configuration
This component handles the creation and duplication of Datadog API and APP keys. This component specifies a source
account (usually auto) and a format for copying keys. You specify a source and destination format and a key store.
This allows you to use separate keys for each account, tenant, or anything in between. We recommend either a single set
of keys per Organization or tenant.
This component also handles default configurations such as Datadog URL and provides a default configuration for other
components to utilize via its submodule datadog_keys.
Use a configuration similar to the following but check the
README.md for exact input references.
components:
  terraform:
    datadog-configuration:
      settings:
        spacelift:
          workspace_enabled: true
      vars:
        enabled: true
        name: datadog-configuration
        datadog_secrets_store_type: SSM
        datadog_secrets_source_store_account_stage: auto
        datadog_secrets_source_store_account_region: "us-east-2"
        datadog_site_url: us5.datadoghq.com
The most important variables are the key patterns to determine how keys are placed and the Datadog site URL configuration which should match how you signed up with Datadog.
Datadog Integration
Vendor in this component with atmos vendor pull -c datadog-integration. This component configures the integrations you
have between Datadog and your AWS Accounts. This component is deployed to every account (except root and identity)
to allow data from everywhere.
This component is used by other components as this component creates the Datadog role for your account.
Deploy this with atmos terraform deploy datadog-integration -s ${tenant}-gbl-${stage}
alternatively
atmos terraform deploy datadog-integration -s core-gbl-artifacts
atmos terraform deploy datadog-integration -s core-gbl-audit
atmos terraform deploy datadog-integration -s core-gbl-auto
atmos terraform deploy datadog-integration -s core-gbl-dns
atmos terraform deploy datadog-integration -s core-gbl-network
atmos terraform deploy datadog-integration -s core-gbl-security
atmos terraform deploy datadog-integration -s plat-gbl-sandbox
atmos terraform deploy datadog-integration -s plat-gbl-dev
atmos terraform deploy datadog-integration -s plat-gbl-staging
atmos terraform deploy datadog-integration -s plat-gbl-prod
Datadog Monitors
The datadog-monitor component creates monitors for Datadog. It contains a catalog of monitor entries that are deployed
by default to every account this is deployed to. This component is deployed globally as it is only deployed once per
account. By default, we only apply this to auto and plat accounts. However, it can be added to more accounts as
necessary for monitoring.
Monitors are cataloged through YAML files and perform substitution through Terraform syntax, for example ${stage}. It
is important to note that this is different from Datadog syntax which is {{ stage }}. Anything in Datadog syntax will
be inserted into the monitor as is, whereas Terraform will be substituted. That way we can deploy the same monitors
across accounts and filter by stage or variable known to Terraform.
In order to add new monitors, simply add a yaml file to components/terraform/datadog-monitor/catalog/monitors/. By
default, the component includes a global collection of monitors:
components/terraform/datadog-monitor/catalog/monitors/
├── README.md
├── catalog
│   └── monitors
│       ├── aurora.yaml
│       ├── ec2.yaml
│       ├── efs.yaml
│       ├── elb.yaml
│       ├── host.yaml
│       ├── k8s.yaml
│       ├── lambda-log-forwarder.yaml
│       ├── lambda.yaml
│       ├── rabbitmq.yaml
│       └── rds.yaml
├── component.yaml
├── context.tf
├── main.tf
├── outputs.tf
├── provider-datadog.tf
├── providers.tf
├── variables.tf
└── versions.tf
Alternatively, we can add an additional level of nesting to the datadog-monitor catalog to categorize monitors by
account. By arranging the catalog as follows, we can distinguish which monitors are deployed to a given stack with
local_datadog_monitors_config_paths. This allows us to specify entirely unique monitor paths for each stage.
components/terraform/datadog-monitor/catalog/monitors/
├── README.md
├── catalog
│   └── monitors
│       ├── _defaults
│       │   └── example.yaml
│       ├── plat
│       │   ├── dev
│       │   │   └── example.yaml
│       │   ├── staging
│       │   └── prod
└── ...
# stacks/org/acme/plat/dev/monitoring.yaml
components:
  terraform:
    datadog-monitor:
      vars:
        local_datadog_monitors_config_paths:
          - catalog/monitors/_defaults/*.yaml
          - catalog/monitors/plat/*.yaml
          - catalog/monitors/plat/dev/*.yaml
# stacks/org/acme/plat/prod/monitoring.yaml
components:
  terraform:
    datadog-monitor:
      vars:
        local_datadog_monitors_config_paths:
          - catalog/monitors/_defaults/*.yaml
          - catalog/monitors/plat/*.yaml
          - catalog/monitors/plat/prod/*.yaml
Each monitor is then defined in components/terraform/datadog-monitors/catalog/monitors/_defaults/
categorized by component. It can then be extended into other stages, where the later in the array
(local_datadog_monitors_config_paths) the higher precedence it takes in merging.
Please see datadog-monitor for more information.
Lambda Log Forwarders
This component is pretty straightforward to vendor and deploy. The important variables of note are
forwarder_rds_enabled: false
forwarder_log_enabled: false
forwarder_vpc_logs_enabled: false
as these variables determine which logs are forwarded to Datadog. The main implication of this decision is the cost, as VPC Flow logs can become incredibly expensive.
Datadog Logs Archive
This component is also relatively simple to deploy as well. Simply vendor in the component and deploy it.
atmos vendor pull -c datadog-logs-archive
Use the configuration in the component readme as the stack/catalog entry.
atmos terraform deploy datadog-logs-archive -s core-gbl-auto
EKS
Datadog Agent
For EKS deployments we need to deploy the Datadog-Agent, this component deploys the helm chart for the Datadog Agent, it allows the Datadog Agent to be fully customized and also provides a format to support cluster-checks, which are a cheaper version of synthetic checks (though less feature-rich).
Vendor in the component and begin deploying. This component is deployed to every region and account where you have an EKS Cluster.
The component allows customizing values passed to the helm chart, this can be useful when passing variables to support
features such as IMDSV2
components:
  terraform:
    datadog-agent:
      vars:
        enabled: true
        name: "datadog"
        description: "Datadog Kubernetes Agent"
        kubernetes_namespace: "monitoring"
        create_namespace: true
        repository: "https://helm.datadoghq.com"
        chart: "datadog"
        chart_version: "3.6.7"
        timeout: 1200
        wait: true
        atomic: true
        cleanup_on_fail: true
        cluster_checks_enabled: true
        helm_manifest_experiment_enabled: false
        tags:
          team: sre
          service: datadog-agent
          app: monitoring
        # datadog-agent shouldn't be deployed to the Fargate nodes
        values:
          agents:
            affinity:
              nodeAffinity:
                requiredDuringSchedulingIgnoredDuringExecution:
                  nodeSelectorTerms:
                    - matchExpressions:
                        - key: eks.amazonaws.com/compute-type
                          operator: NotIn
                          values:
                            - fargate
          datadog:
            env:
              - name: DD_EC2_PREFER_IMDSV2
                value: "true"
This component should be highly customized to meet your needs. Please read through the Datadog Dogs to determine the best configuration for your setup.
References
- Configure the Datadog Agent on Kubernetes
- Duplicate hosts with Kubernetes on AWS (EC2 or EKS)
- Datadog Agent Helm Chart Values Reference
- Cluster Agent Commands and Options
- Kubernetes Trace Collection
Datadog Private Locations (Optional)
This component is the Datadog Helm chart for deploying synthetic private locations to EKS. This is useful when you want Datadog Synthetic Checks to be able to check the health of pods inside your cluster, which is private behind a VPC.
This component is straight forward and requires little to no stack customization.
Use the catalog entry included with the datadog-synthetics-private-location documentation to get started.
ECS
ECS-Service
This primary component should be familiar as it deploys your applications. It also has several variables with hooks to deploy the Datadog Agent as a sidecar container (useful for fargate). to get started simply add the following variables to your ECS Service:
datadog_agent_sidecar_enabled: true
datadog_log_method_is_firelens: true
datadog_logging_default_tags_enabled: true
# in addition set your service logging method to awsfirelens
containers:
  service:
    log_configuration:
      logDriver: awsfirelens
      options: {}
This will add The Datadog Agent sidecar to your service, add default tags, and add Firelens as the logging method which ships logs directly to Datadog.
datadog-private-location-ecs
This component deploys an ECS task that handles private locations for ECS. This is the counterpart to the Eks version. To get started simply vendor in and use the stack catalog entry in the readme.