How to Implement Incident Management with OpsGenie
Implementing incident management with OpsGenie involves setting up a standardized, reusable method to handle incidents effectively. This guide outlines the strategy used by Cloud Posse to integrate OpsGenie with Datadog for incident management, ensuring rapid response and remediation while minimizing alert fatigue.
Introduction
Cloud Posse advises customers with very similar monitoring requirements because we have standardized our delivery model for our customers. This is our strategy for implementing OpsGenie for Incident Management. The actual fine-tuning of any implementation needs to be tailored to the customer’s needs based on the Design Decisions.
Our goal with this guide is to define the reusable method for incident management we use with our customers that we can readily implement time and time again.
Also, make sure to review How to Implement SRE with Datadog.
Problem
The number of events and alerts happening in modern systems easily overwhelms the Signal-to-Noise Ratio (SNR) making them generally ineffective as a means to escalate. We can adjust thresholds all day long and still never silence the system. And even if we silence them, it only reduces our visibility but not the fact that they are still happening. All we really care about is what measurably and adversely affects the business. When the business is affected, we need to rapidly respond, triage and remediate the issue. Tools like Datadog, Sentry, NewRelic are primarily concerned with (and very good at!) raising alerts, but not yet mature at handling complex escalations. Datadog's Incident Management is not yet a mature product and there’s no Terraform support for managing it.
Solution
Route all events through Datadog. Leverage the advanced capabilities of Datadog to surface meaningful alerts that are enriched with tags used by OpsGenie to escalate based on a matrix of rules.
This Document describes the OpsGenie side of things and how it works with Datadog, also see, why we Use OpsGenie for Incident Management and How to Implement SRE with Datadog.
Terminology
The terms event, alert and incident are frequently used interchangeably, but we need to define them strictly for our purposes.
- Event
An event is an observed change to the normal behavior of a system, environment, process, workflow or person. All events have tags. See Tag Mapping. Example: AWS Console Login by IAM User
- Alert
An alert is a notification that a particular type of event (or series of events) has occurred, which is sent to responsible parties for the purpose of spawning action. Example: AWS Console Login using Root User Credentials
- Incident
An incident is a type of event that negatively affects the Confidentiality, Integrity, and/or Availability (CIA) at an organization in a way that impacts the business. Read more here
- Escalation
An escalation is a means of responding to an event based on schedules, rotations, and routing rules that deliver notifications via multiple mediums (email, phone, SMS, app, webhook, etc) Example: Send a notification event to the mobile device of the on-call engineer, if no acknowledgement after 5 minutes, fallback to the backup on-call engineer
- Service
A service is a deployable instance, or part, of an application as a whole. A service is deployed to many environments. This is important to understand because it follows the Datadog Service Definition [1] [2], and maps directly to an OpsGenie Service (see below). OpsGenie Official Service Definition Example: Cert-Manager is a Service, as part of an EKS app, deployed to many environments.
- App
An App is a collection of services that represent a group of functionality for the end user. This acts as a logical grouping and is on the roadmap for cascading impact. Example: My-EComm-Store is an app, EKS is an app (end user is developers)
- Team
A Team is a group of users that an alert can be routed to. Opsgenie Team Definition Example: SRE is a team
- Routing Rules
- A team has Routing Rules which controls the logic of where an event goes within a team.
- Escalations
- A team has Escalations, as described above.
- Schedules
- A team has Schedules which allows users to have times that they are on call.
- Owned Services
- A team has owned Services, as described above.
Some definitions borrowed from Daniel Miessler's Event Alert Incident
All incidents are events, but not all events and alerts are incidents.
Since SLOs are by definition business-critical, any SLO violation is automatically an incident.
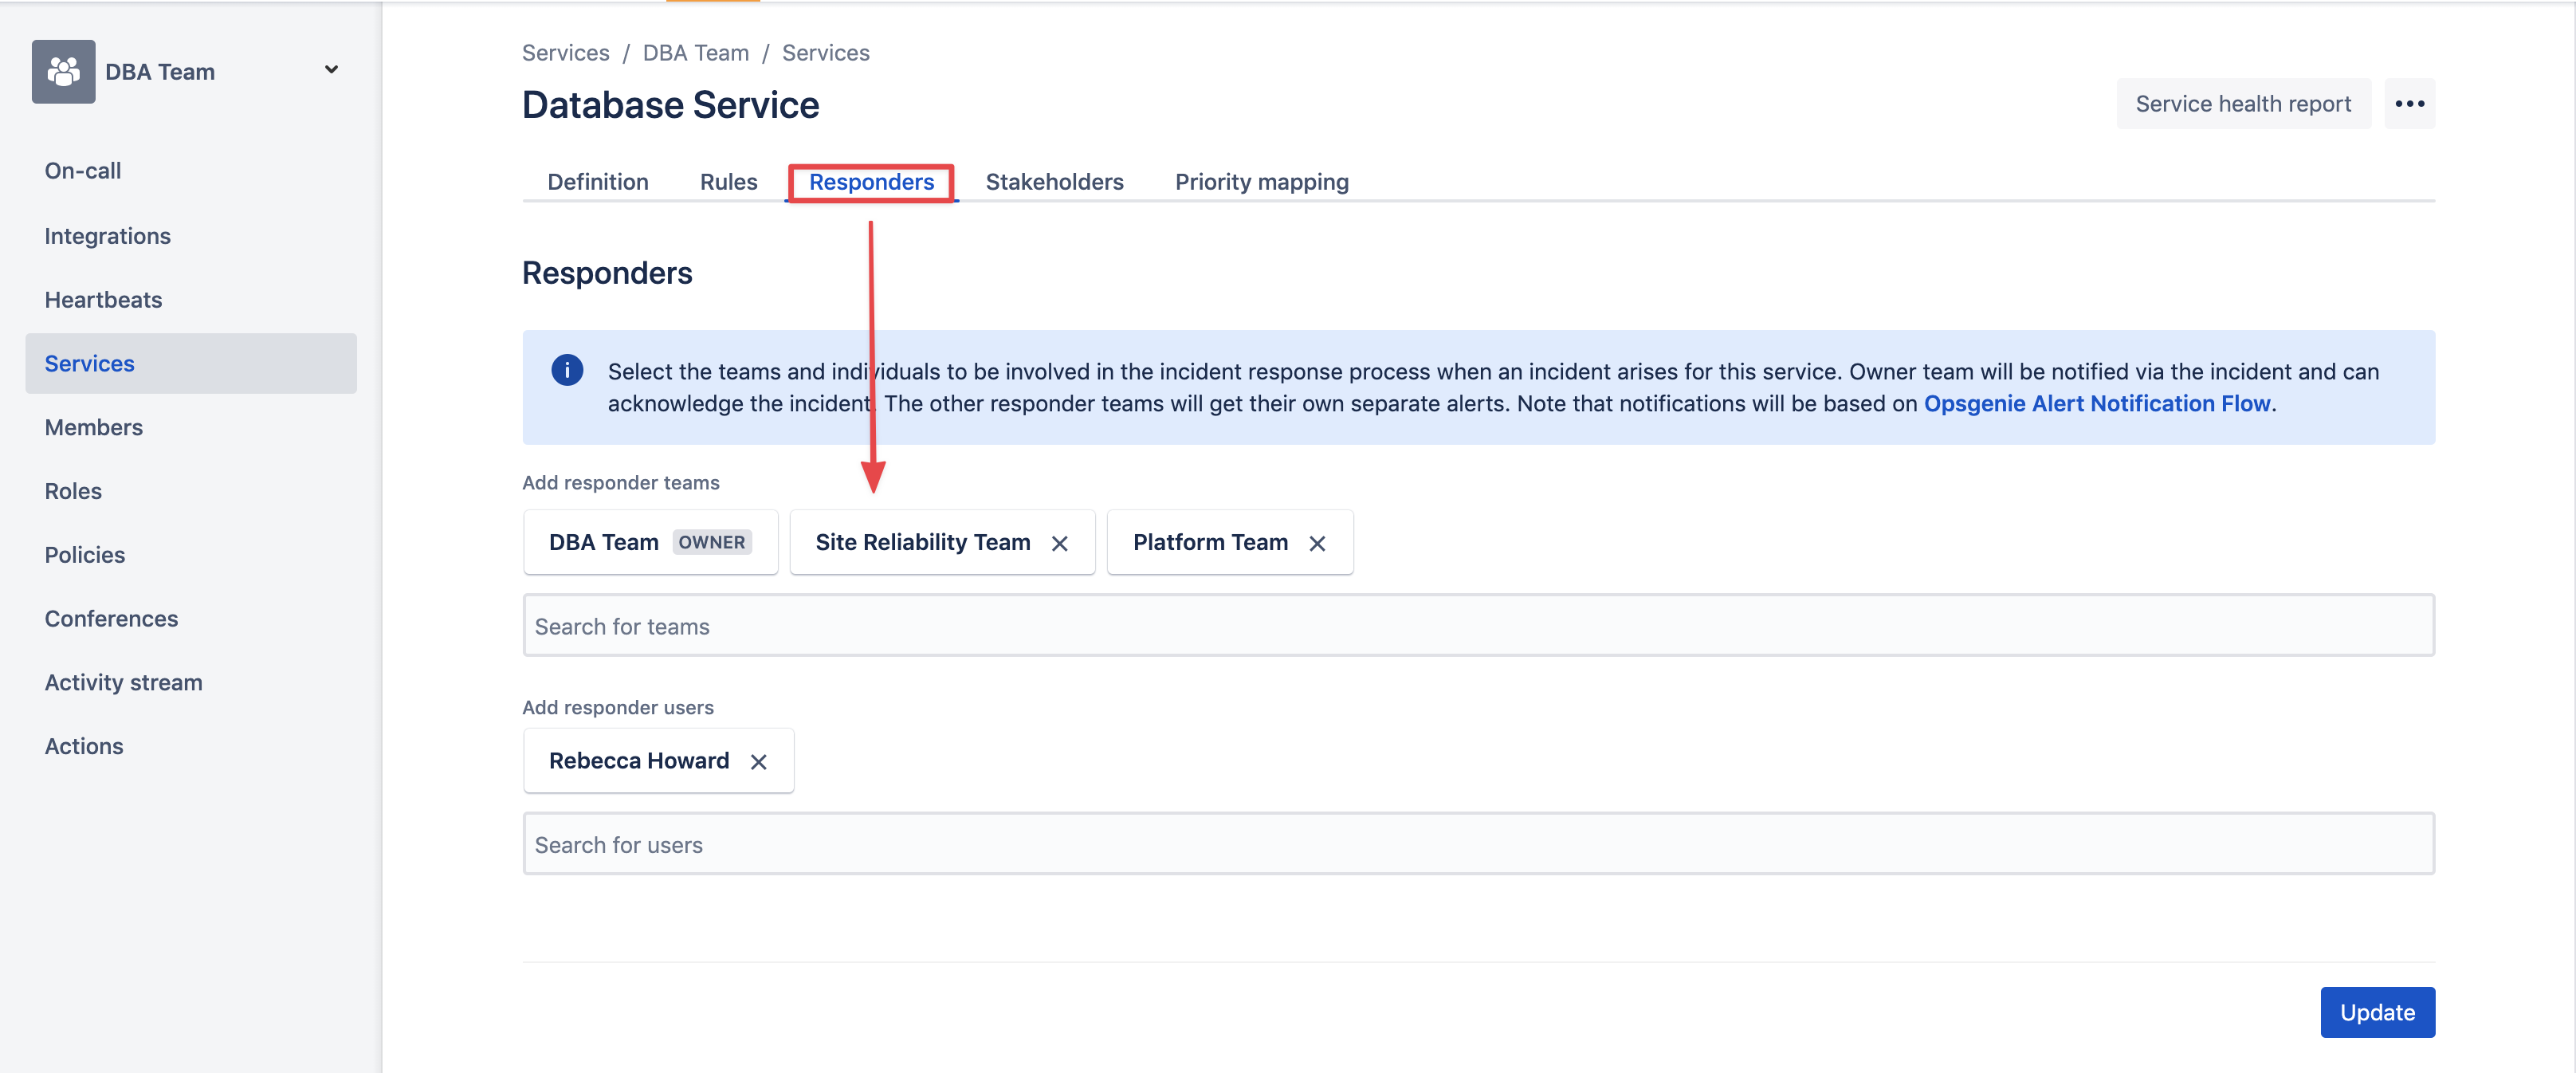
An important note here is the Service mapping from Datadog to OpsGenie. It is a 1-1 Mapping, Datadog has a very easy to view graphing and listing of these services. In OpsGenie this requires explicit owning of a service by a team.
Incidents
An Incident is an escalated alert with a business impact. All SLOs by definition have business impacts and therefore when violated should be considered an incident. We define anything of severity P1 or P2 as an incident and therefore having business impact. An alert is automatically escalated to an incident by its severity as defined in the monitor.
Component: opsgenie-team
Component Page
How to Guides
- How to Sign Up for OpsGenie?
- How to Create New Teams in OpsGenie
- How to Add Users to a Team in OpsGenie
- How to Create Escalation Rules in OpsGenie
- How to Setup Rotations in OpsGenie
- How to Onboard a New Service with Datadog and OpsGenie
Goals
-
We want to be able to define a simple DSL in YAML for expressing an opinionated way to define escalations.
-
We want to be able to define an opinionated tag-based approach to OpsGenie so that any integration (e.g. Datadog) can send alerts and incidents, by simply adding tags like
team:sre,service:eks. -
We want to define a clear line between a constant alerting ruleset (Opsgenie), and the data being fed to it (Datadog)
-
OpsGenie Component shouldn’t need to change unless teams or services change.
-
New alerts, monitors, and SLOs do not require any change to the OpsGenie configuration.
-
It is the responsibility of the integration (e.g. Datadog) to determine the tags. If the integration cannot enrich its own events with tags, that integration should pass through something like Datadog which can enrich the events.
OpsGenie cannot escalate based on any mathematical expressions (e.g. rate or frequency of alerts). As an alternative, consider using Datadog to determine the rate or frequency of some event and alert on that.
What does it do
Our OpsGenie-Team Component handles the creation of many resources. The component is highly configurable to allow full reference to the underlying resources. However, we also want to have sane defaults that allow short snippets to quickly spin up new fully-fledged teams in OpsGenie.
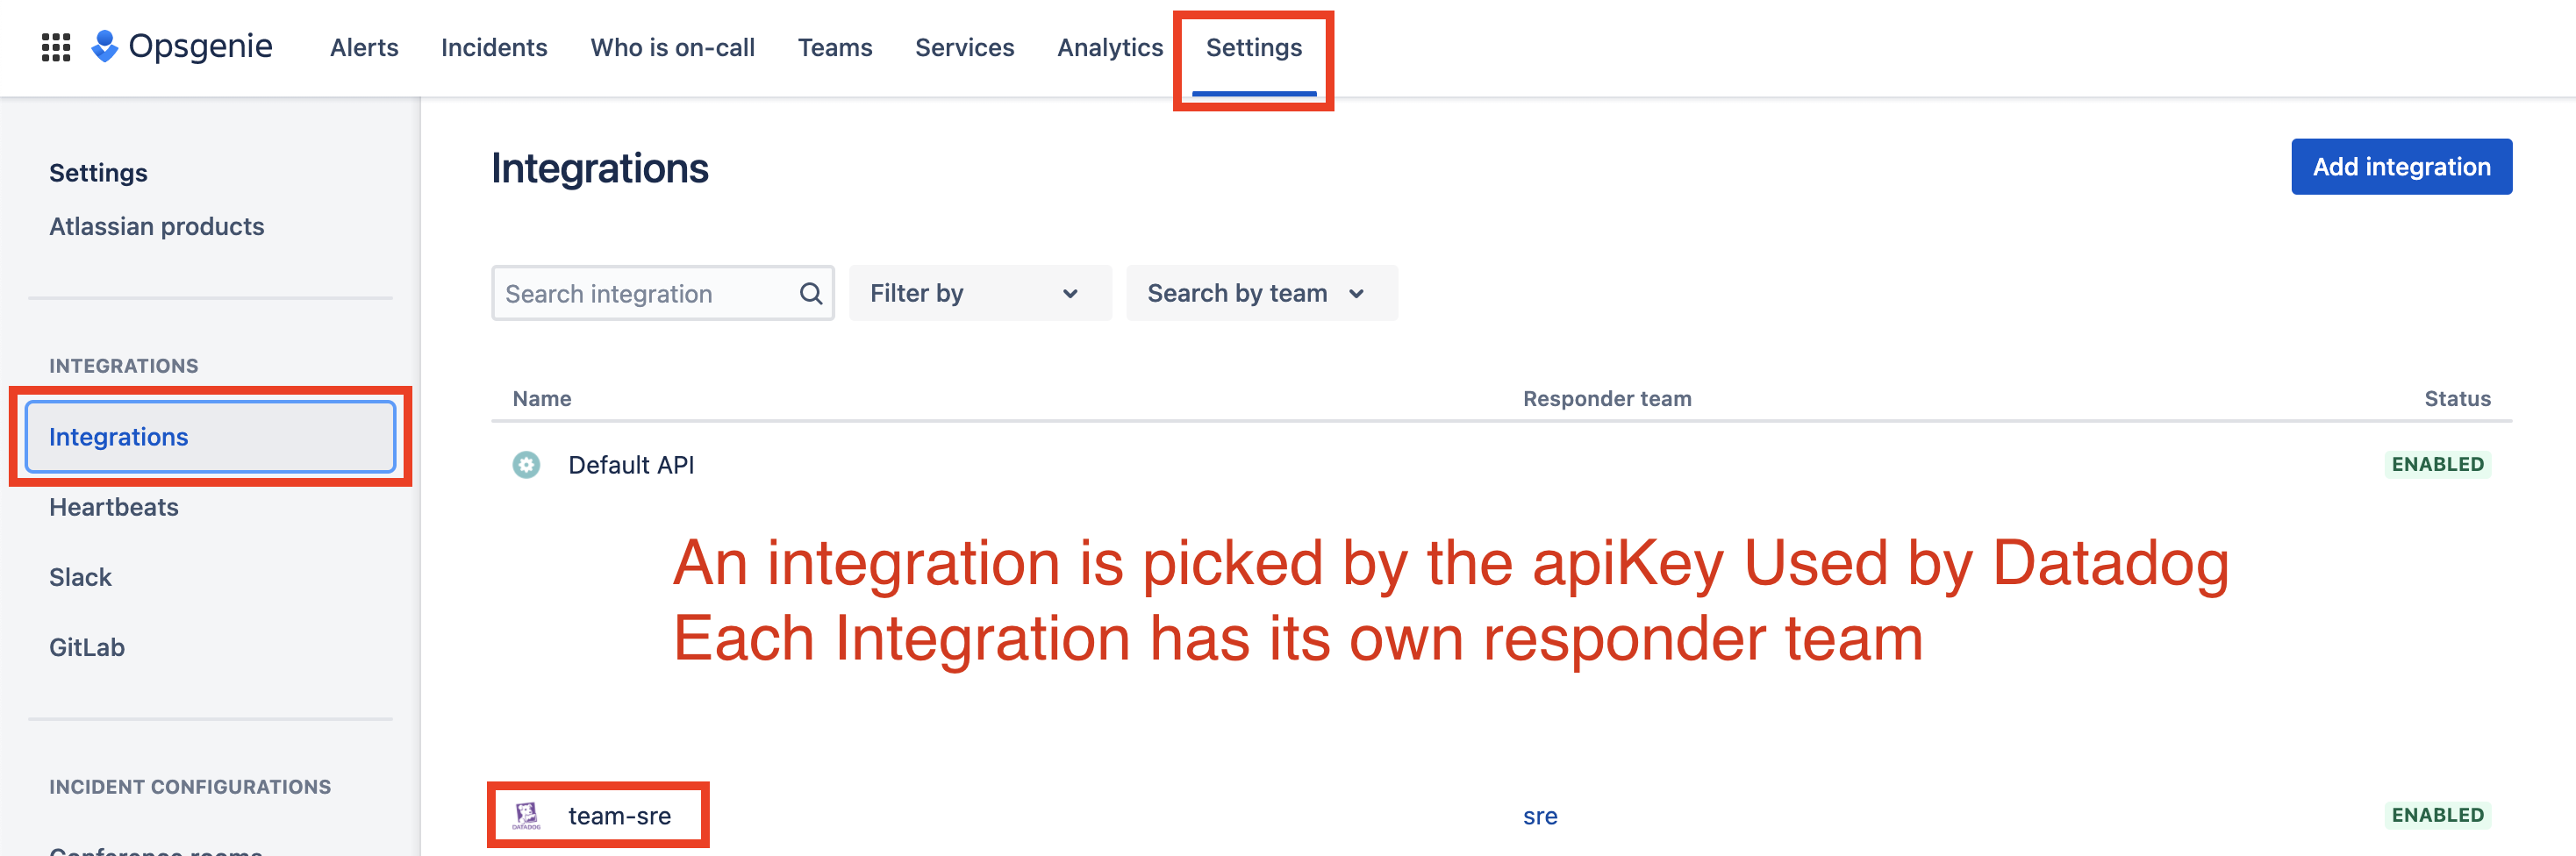
The component follows the DataDog recommended way for integrating with OpsGenie. By creating one integration per team. https://docs.datadoghq.com/integrations/opsgenie/
Limitations
Cannot Add dependent Services
- Incident Routing cannot add dependent services - in api versions
v1andv2aservice_incident_ruleobject hasserviceIdas type string, inwebappthis becomesserviceIdsof typelist(string)
https://github.com/opsgenie/terraform-provider-opsgenie/issues/282
Cannot Add Stakeholders
https://github.com/opsgenie/terraform-provider-opsgenie/issues/278
No Resource to create Slack Integration
-
https://github.com/DataDog/terraform-provider-datadog/issues/67
-
Full list of integrations supported https://docs.opsgenie.com/docs/integration-types-to-use-with-api
-
The rules (e.g. match conditions, like priority) for the Slack integration are in the
opsgenie_integration_actionbut since there isn’t a data source to pull the integration id, if we wanted to create this resource in terraform, we’d need the user to manually grab the guid integration id in order to create the rule.
User management can be cumbersome
-
SAML/SSO integration in OpsGenie does not retrieve any specific attributes
-
There is no way to map a SAML/SSO user to an OpsGenie team or role
-
Creating users at the moment is done manually using yaml which may not be desired
-
An alternative is a separate point of truth such as Okta or Github where teams are already managed. If this is the case, we can use the
okta_userorgithub_userdata source, grab a specific attribute from okta or team associated to the gh user, and map that to the same in opsgenie usingopsgenie_userdata source.
How it Works
Alerting a Team
A team is alerted by tagging their datadog integration name in the message of an alert.
e.g. adding @opsgenie-<integration_name>. This can be done automatically by a team tag. In code this looks like @opsgenie-${team.name} where datadog fetches the team from the label applied to the resource.
The tag must be fed to a monitor via the data source (like aws integration - and the aws resource), Datadog will not use a monitor tag.
Thus if a message for datadog is @opsgenie-${team.name} datadog looks for the team tag and will change the message to be @opsgenie-sre if the team was sre. Datadog knows to look at an opsgenie integration because of the @opsgenie portion, then under that integration configuration, looks for a Datadog Integration Name with the team specified, sre in this case. If it’s found then Datadog now knows what integration to use! If it doesn’t find it, datadog looks for a Datadog Integration name called datadog, which acts as the default.
Each Monitor has a default Integration to use. Each Integration has a default team associated to it.
A monitors message is the message field + the alert_tag of the component. Where the alert tag appends the @opsgenie-${team.name}
Incidents Rules
The OpsGenie Abstract component creates the rules that specify when an alert is an incident.
We recommend that all P1 and P2 alerts are Incidents. We recommend all teams use company defaults and only in very special cases do teams override this setting. This helps promote an understanding of how severe a problem is.
Severity Mapping
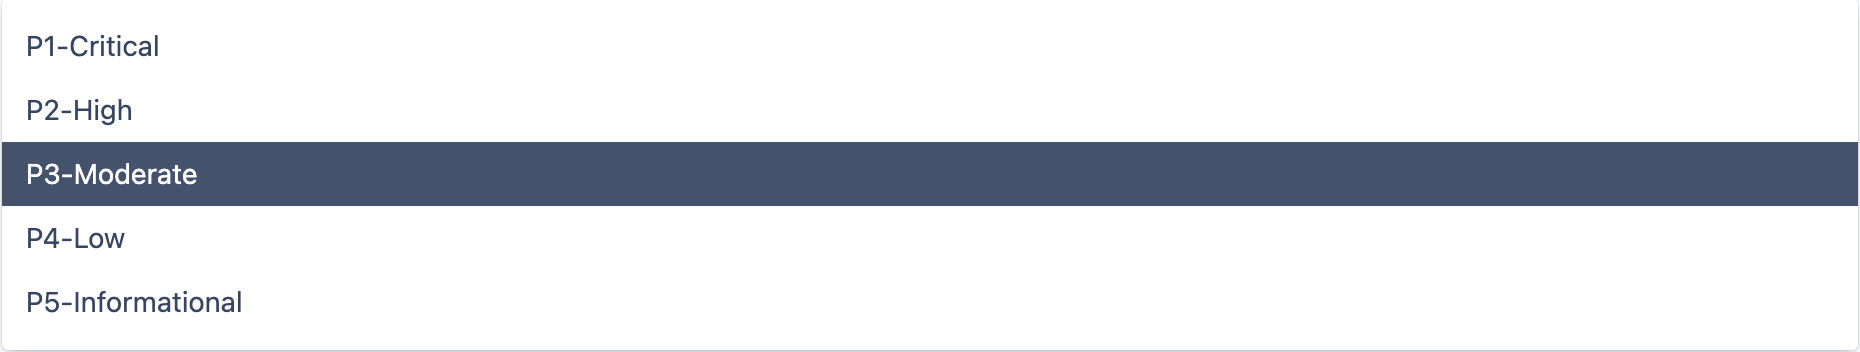
The severity levels (P1-P5) should be standardized at an organizational level and documented in an ADR. The severity level determines the escalation path. We recommend for consistency that given any severity, the escalation mechanism is identical, but who it escalates to will vary based on service.
In general, reserving P1 and P2 for reactive responses and escalate 24x7. P3-P5 are for proactive responses and only escalate during business hours, if at all.
It’s up to every organization to define these mappings for their organization as it will form the basis of the escalation matrix. The severity should be scaled based on the impact to the business, not necessarily the impact to the service. For example, if a non-essential microservice is entirely offline, but is does not effect the delivery of core business services, it should still not be a P1.
Datadog priorities map one-to-one to OpsGenie severity.
Recommendations
| Severity | Response | Event | Description | Examples |
|---|---|---|---|---|
| P1 | Reactive | Incident | SLO violation. Someone’s getting paged 24x7. All hands on deck. Production is down. All customers are affected. Critical 24x7 | - Production Backend API has been down for 3 hours this week (Failed SLO) - Production Backend API is down (Over 5 min) (Synthetic Failed) → SLO not broken yet but in violation (SLO Trending to failure) |
| P2 | Reactive | Incident | SLO violation. Error budget in jeopardy of being depleted. Some customers are being severely affected. Someone’s getting paged 24x7. Important 24x7 | - Production API Down 1 Hour this week (Warning SLO) - Production API Down 1 Minute This week (SLO Trending to Warning) - Customers in us-west-2 Are experiencing significant latency (Breaks SLO on response time but not all customers) |
| P3 | Proactive | Alert | Alert Created Regular Business Hours: App Failures, Crashes, Minor Downtime(non-critical apps), SLI Violation. Lesser Violations that could lead to P1/P2 | - Pods of deployment X are crashlooping - High Response Time Backend Service |
| P4 | Proactive | Alert | Things that need to be acknowledged by a team but will not necessarily lead to failures. | - Number of Kube nodes reached > 10 |
| P5 | Proactive | Event | Informational Alarms that self resolve. Metrics could create be created off number of these. | - Feature Flag enabled in environment X |